
The final data on business activity indices in the services sector in Europe, the United Kingdom, and the United States were published.
Details of statistical indicators:
In Europe, services PMI fell from 48.9 to 48.8, with a forecast of 48.9. The composite index fell from 48.9 to 49.1 points.
The euro was overbought during the release of the data, so its pullback could be associated not only with negative statistics.
United Kingdom services PMI fell from 50.9 to 50.0, with forecasts of a decline to 49.2. The composite index fell from 49.6 to 49.6.
The pound sterling stood still at the time of the publication of statistical data.
Meanwhile, United States services PMI rose from 43.7 to 49.3 against an expected 49.2 points. The composite index rose from 44.6 to 49.5.
Also, the ADP report on the level of employment in the US was published, where an increase of 208,000 jobs was recorded in the period of September.
Overall, the data for the United States is strong. The dollar is strengthening in value.
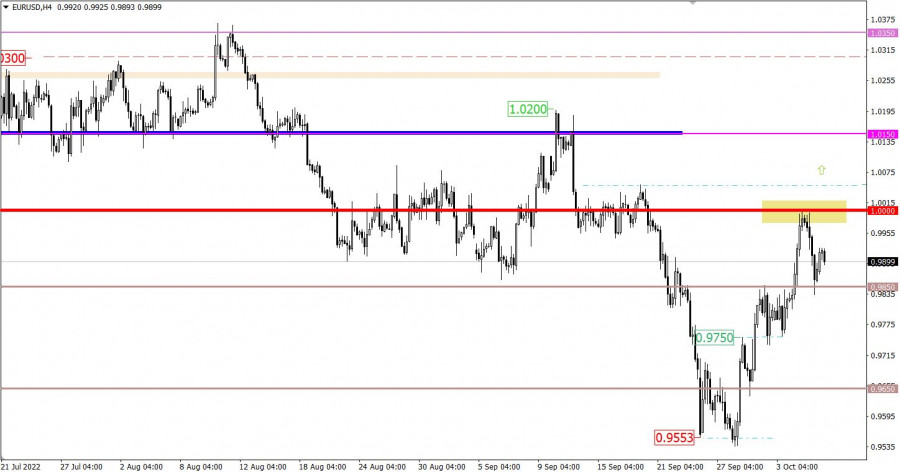
The EURUSD currency pair has completed the construction of a corrective move near the parity level. As a result, there was a price rebound, which returned the quote to the previously passed level of 0.9850. Now, this level plays the role of support in the market.
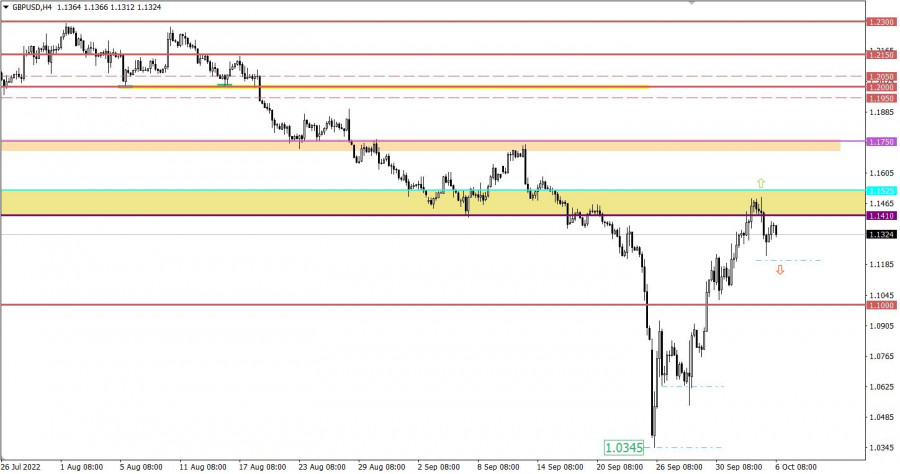
The GBPUSD currency pair, following the euro, has moved into a pullback stage. The price area 1.1410/1.1525 serves as resistance, where the quote has recently approached.
Today, data on retail sales in the eurozone will be released. Based on forecasts, it is expected that the rate of their decline should accelerate from -0.9% to -2.2% (consensus -1.7%), which is considered a negative factor for the economy and the euro.
During the American trading session, weekly data on jobless claims in the United States will be published, which are expected to decline. This is a positive factor for the US labor market, if the forecasts of analytical agencies coincide.
Statistics details:
The volume of continuing claims for benefits may decline from 1.347 million to 1.286 million.
The volume of initial claims for benefits may rise from 193,000 to 200,000.
Time targeting:
EU Retail Sales – 09:00 UTC
US Jobless Claims – 12:30 UTC
For the downward movement from the parity level to continue forming, the quote needs to stay below 0.9850 in a four-hour period. This move will open the way for sellers in the direction of 0.9750. The absence of holding the price below the control value allows the emergence of an amplitude of 0.9850/1.0000 in the market. In this case, the current corrective move may continue to form.
In this situation, a technical signal of a subsequent increase in the volume of short positions in the pound sterling may occur when the price holds below 1.1200 in a four-hour period. Until then, the market may experience a fluctuating swing along the resistance area. Presumably, a signal about the prolongation of the correction will appear only after the price holds above 1.1525.
A candlestick chart view is graphical rectangles of white and black light, with sticks on top and bottom. When analyzing each candle in detail, you will see its characteristics of a relative period: the opening price, closing price, and maximum and minimum prices.
Horizontal levels are price coordinates, relative to which a stop or a price reversal may occur. These levels are called support and resistance in the market.
Circles and rectangles are highlighted examples where the price of the story unfolded. This color selection indicates horizontal lines that may put pressure on the quote in the future.
The up/down arrows are the reference points of the possible price direction in the future.