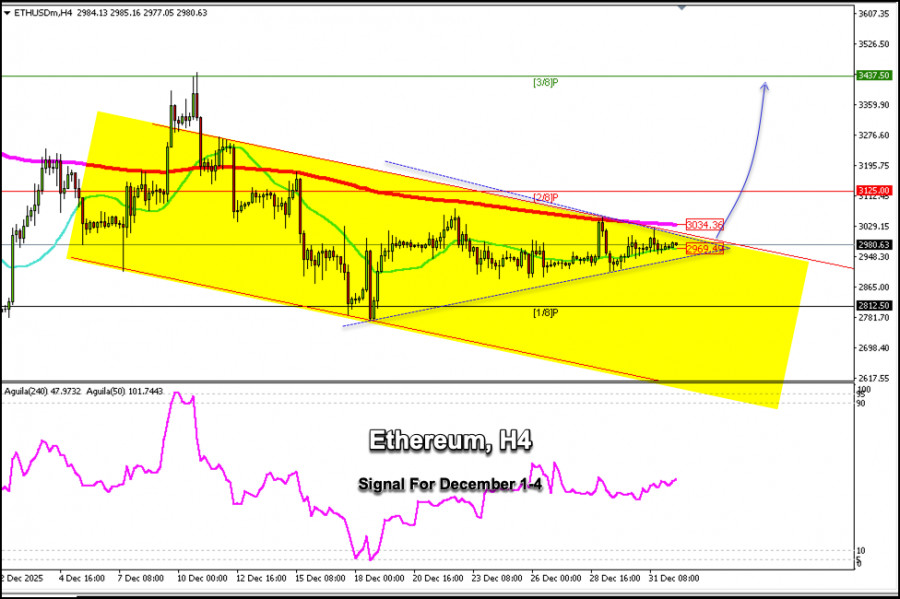
Ethereum is trading around $2,980 above the 21 SMA and within a downtrend channel formed since early December. On the H4 chart, we can see a consolidation of Ether, and a sharp break above the 200 EMA around $3,034 is likely to occur.
On the H4 chart, we can see the formation of a symmetrical triangle. Therefore, if ETH/USD consolidates above the psychological level of $3,000 in the coming days, we could expect it to reach the 3/8 of the Murray level at $3,437.
Conversely, if ETH/USD falls below the symmetrical triangle pattern, we could expect a drop towards the 1/8 Murray at $2,875. Finally, the instrument could reach the bottom of the downtrend channel around $2,590.
The Eagle indicator is showing positive signals, so we should expect confirmation above $3,000 to buy or below $2,930 to sell.
Our outlook remains negative, so we will look for opportunities to sell if Ether falls below $2,950.