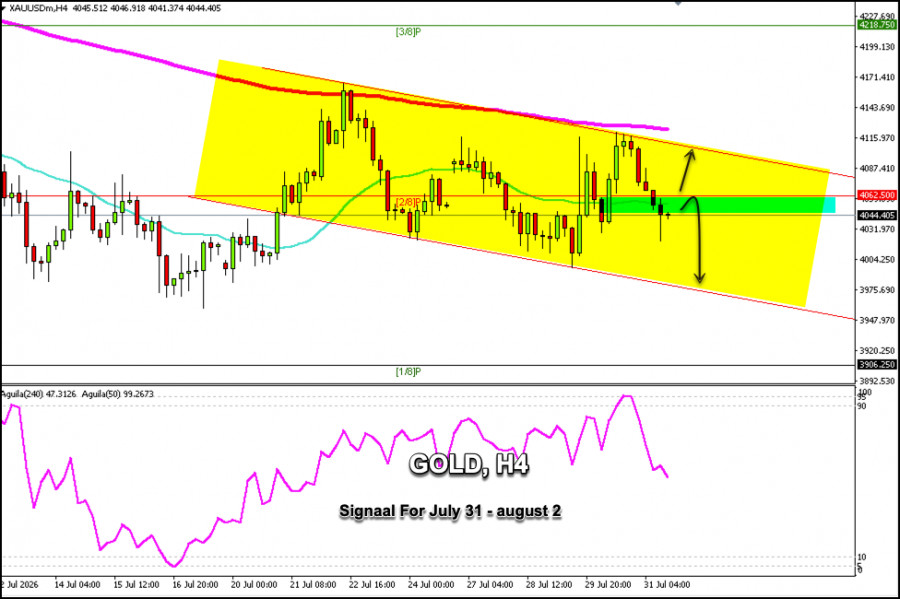
Gold is trading around $4,044, below the 2/8 Murray line and the 21-period simple moving average (SMA), showing a downtrend and trading within a bearish channel that has been forming since July 20.
On the H4 chart, we can see that gold, after hitting a low of $4,020, is rebounding and could continue to rise in the coming days. The Eagle indicator shows a negative signal, so if the price consolidates below the 2/8 Murray level, around $4,062, it could resume its downtrend.
Conversely, if gold trades above $4,062, the outlook could be positive, and the price could reach the upper band of the bullish channel, around $4,086.
Since gold is currently within a bearish channel, it is likely to encounter strong resistance around $4,115 or solid support around $3,980 in the coming days.
We should monitor the 2/8 Murray zone to take long or short positions, as this is a key level for gold.