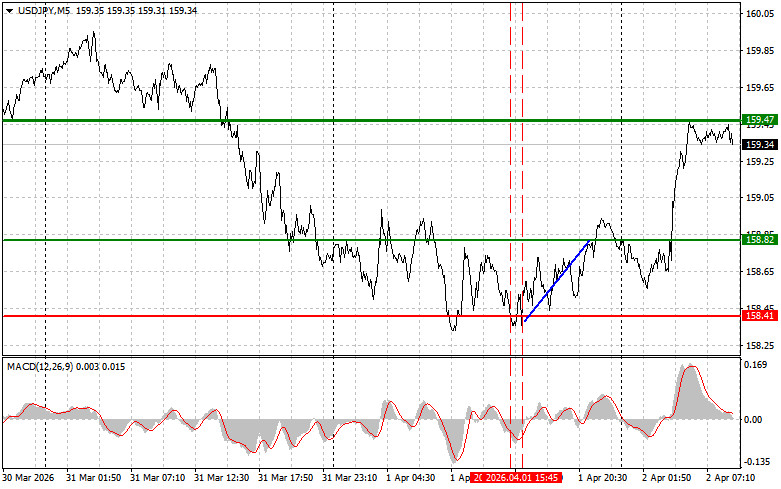
The test of the 158.41 price level occurred when the MACD indicator had dropped significantly from the zero mark, which limited the pair's downward potential. The second test of 158.41 allowed for the implementation of Buy Scenario #2 for the dollar, resulting in a rise of the pair to around 158.82.
The previous trading session was marked by the resumption of a downward trend in risk assets. This happened in response to strong US economic data and ambiguous statements from US President Donald Trump. Addressing the nation, the American leader first expressed optimism about the imminent resolution of the military conflict in Iran. However, he then added that the United States intends to initiate new strikes against Iran shortly. Fearing further escalation of the situation in the Middle East, investors began to redirect capital into safer instruments, selling off the Japanese yen, as the contradictory signals from a significant figure like the US president create considerable volatility and complicate the forecasting of market trends, which inevitably affects investor sentiment globally.
Today's data showing a sharp 11% contraction in Japan's monetary base also put slight pressure on the yen against the dollar.
As for the intraday strategy, I will focus on implementing Buy Scenarios #1 and #2.
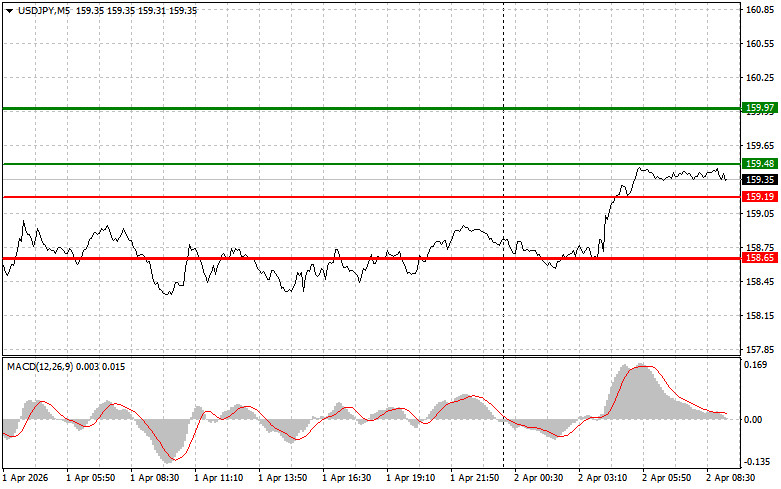
Scenario #1: I plan to buy USD/JPY today upon reaching the entry point around 159.48 (green line on the chart) with a target growth to the level of 159.97 (thicker green line on the chart). At 159.97, I plan to exit my long positions and open short positions back (anticipating a move of 30-35 pips in the opposite direction from that level). It is best to return to buying the pair on corrections and significant pullbacks in USD/JPY. Important! Before buying, ensure the MACD indicator is above the zero mark and just starting to rise from it.
Scenario #2: I also plan to buy USD/JPY today in the event of two consecutive tests of the price at 159.19 when the MACD indicator is in the oversold area. This will limit the downward potential of the pair and lead to a market reversal upwards. A rise to the opposite levels of 159.48 and 159.97 can be expected.
Scenario #1: I plan to sell USD/JPY today only after the 159.19 level is broken (red line on the chart), which will trigger a rapid decline in the pair. The key target for sellers will be the 158.65 level, where I plan to exit my shorts and immediately buy back (anticipating a 20-25-pip move in the opposite direction from that level). It is best to sell as high as possible. Important! Before selling, ensure the MACD indicator is below the zero mark and just starting to decline from it.
Scenario #2: I also plan to sell USD/JPY today if the price tests 159.48 twice in a row while the MACD is in the overbought area. This will limit the upward potential of the pair and lead to a market reversal downwards. A decline to the opposite levels of 159.19 and 158.65 can be expected.
Important: Beginner traders in the Forex market need to be very cautious when making entry decisions. It is best to be out of the market before important fundamental reports are released to avoid being caught in sharp price fluctuations. If you choose to trade during news releases, always set stop orders to minimize losses. Without setting stop orders, you can quickly lose your entire deposit, especially if you do not use money management and trade large volumes.
And remember, for successful trading, it is essential to have a clear trading plan, like the one presented above. Spontaneous trading decisions based on the current market situation are inherently a losing strategy for intraday traders.