Japonská společnost Nippon Steel ve středu oznámila, že prostřednictvím dvou podřízených úvěrů získá 800 miliard jenů (5,6 miliardy dolarů) na financování akvizice společnosti U.S. Steel v hodnotě 14,9 miliardy dolarů a refinancování stávajících dluhů.
Japonský výrobce oceli plánuje použít podřízenou půjčku ve výši 500 miliard jenů na částečné splacení překlenovacího úvěru ve výši 2 bilionů jenů, který byl zajištěn v červnu pro účely akvizice.
Samostatná půjčka ve výši 300 miliard jenů bude refinancovat předchozí podřízenou půjčku ve výši 450 miliard jenů.
Větší úvěr poskytnou tři japonské megabanky – Mitsubishi UFJ (NYSE:MUFG) Financial Group, Sumitomo Mitsui Financial Group (NYSE:SMFG) a Mizuho Financial Group (NYSE:MFG) – spolu se Sumitomo Mitsui Trust Group a Development Bank of Japan do 18. září, podle mluvčího Nippon Steel.
Část ve výši 300 miliard jenů bude financována čtyřmi bankami – třemi megabankami a Sumitomo Mitsui Trust.
Na zbývajících 1,5 bilionu jenů překlenovacího úvěru plánuje Nippon Steel použít různé způsoby financování na základě úrokových sazeb, tržních podmínek a dalších faktorů.
The GBP/USD currency pair also showed initial growth, followed by a decline on Tuesday. For the same reasons, there were no important reports coming from the UK, and European (German) reports on industrial production and the trade balance could not stimulate European currencies with their results. As for American reports, the data on existing home sales is unlikely to have spurred a sharp change in market sentiment and dollar growth. Therefore, we believe that the pair's movements on Tuesday were again fully dependent on geopolitical factors. In the first half of the day, risk-averse sentiment prevailed due to Trump's new promises (does anyone still believe them?), while in the second half, risk-on sentiment emerged (though the precise reasons remain unknown). Today, the U.S. will release the inflation report, which could trigger volatility, and we have little doubt that new geopolitical news will emerge. Thus, movements during the day may again be mixed.
From a technical standpoint, the downward trend continues, and the price has failed to consolidate above the Kijun-sen line. The price is located below the Ichimoku indicator lines, but there is currently no trend line, and Friday's dollar growth may be a one-time occurrence. Geopolitics no longer provides the same support for the dollar as it did previously, but in 2026, many factors favor the American currency. Significant reasons are required for a new price decline.
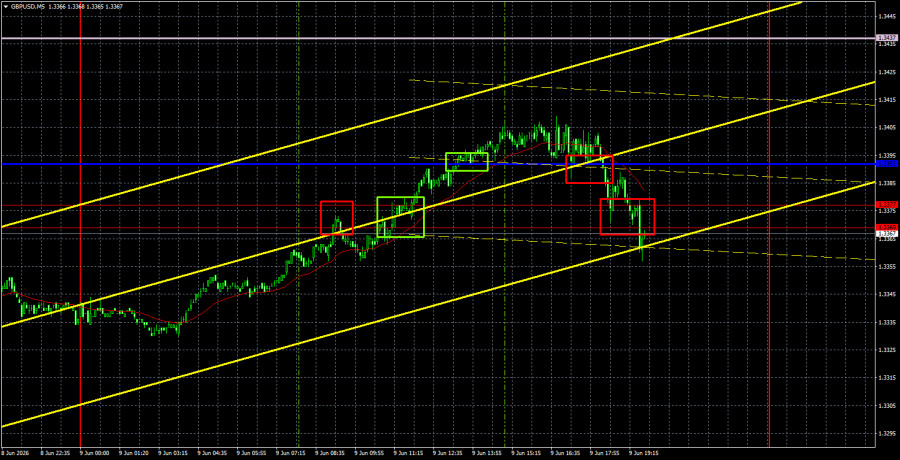
On the 5-minute timeframe on Tuesday, five trading signals were formed. The first sell signal near 1.3369-1.3377 proved false, but the other signals enabled traders to profit. For example, breaking the 1.3369-1.3377 area allowed for long positions, while consolidation below the critical line allowed for shorts. The profit was modest for both trades, as volatility during the European and American sessions was still closer to low.
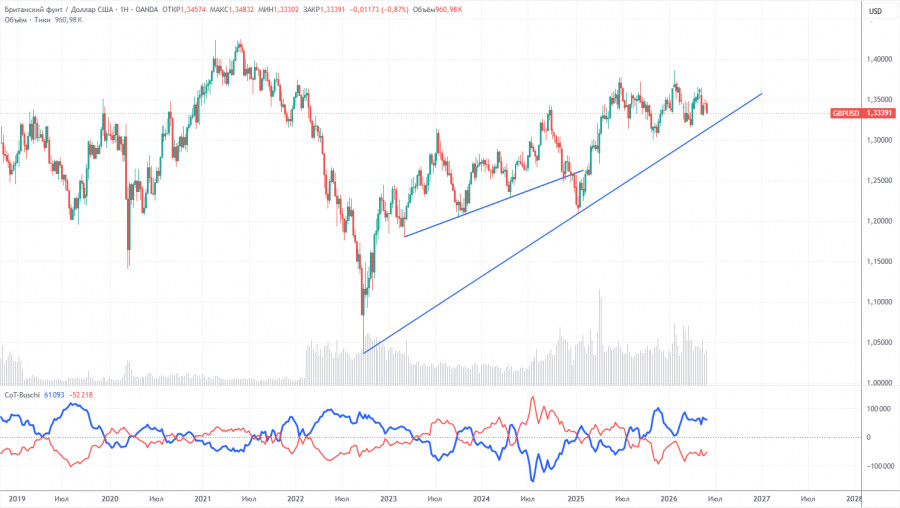
The COT reports for the British pound show that commercial traders' sentiment has shifted consistently in recent years. The red and blue lines representing the net positions of commercial and non-commercial traders frequently cross each other and are generally close to zero. Currently, the lines are moving apart, with non-commercial traders still dominating in terms of short positions. Given the events in the Middle East, it is not surprising that demand for risk currencies is low.
In the long term, the dollar continues to decline due to Trump's policies, which are clearly visible on the weekly timeframe. The trade war will continue in one form or another for a long time, and Trump's policies are aimed directly and indirectly at weakening the American currency. However, geopolitical factors are currently the priority, which have recently provided strong support to the dollar. Since the conflict in the Middle East is not yet resolved, the U.S. dollar may still see growth. According to the latest COT report (dated June 2), the "Non-commercial" group closed 4,300 BUY contracts and 13,500 SELL contracts. Thus, the net position of non-commercial traders increased by 9,200 contracts over the week.
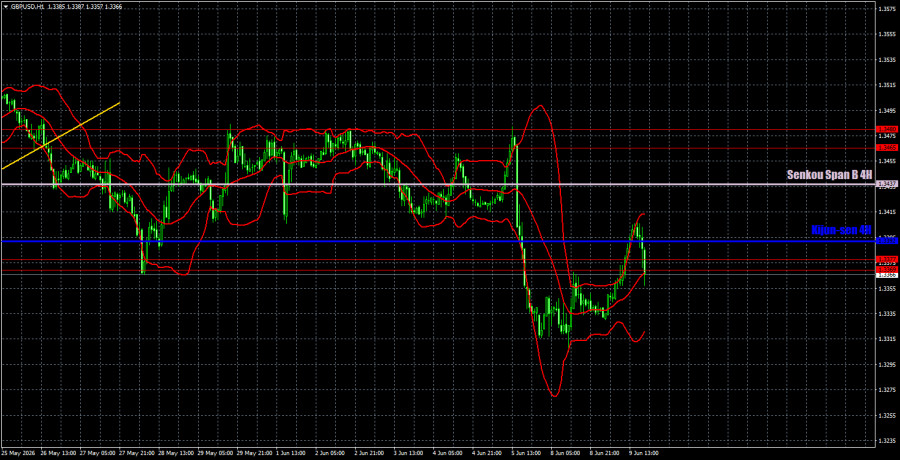
On the hourly timeframe, the GBP/USD pair has ended its upward trend amid renewed tensions around the Strait of Hormuz and relations between Iran and the U.S. The macroeconomic and fundamental background still does not significantly influence the pair's movements (with rare exceptions). We do not believe that without a real escalation of the conflict in the Middle East, the dollar can show strong growth, but the American currency's position is currently more favorable than that of the British pound.
For June 10, we highlight the following important levels for trading: 1.3096-1.3115, 1.3179-1.3187, 1.3369-1.3377, 1.3465-1.3480, 1.3588, 1.3671-1.3681, 1.3751-1.3763. The Senkou Span B line (1.3437) and Kijun-sen (1.3392) may also serve as signal sources. It is recommended to set the Stop Loss at breakeven when the price moves 20 pips in the right direction. The Ichimoku indicator lines may move during the day, which should be considered when determining trading signals.
On Wednesday, no important events or reports are scheduled in the UK, while the U.S. will release an important inflation report that will affect the Federal Reserve's rate decision next week. Additionally, new geopolitical information may come in throughout the day.
Today, traders may consider short positions targeting the 1.3179-1.3187 range if price consolidates below the 1.3369-1.3377 area. Long positions can be opened on a bounce from the 1.3369-1.3377 area, but the Ichimoku indicator lines are in close proximity to this area, making long positions less of a priority.
Support and resistance price levels are indicated by thick red lines, around which movement may end. They are not sources of trading signals.
The Kijun-sen and Senkou Span B lines are Ichimoku indicator lines transferred to the hourly timeframe from the 4-hour timeframe. They are strong lines.
Extremum levels are indicated by thin red lines from which the price has previously bounced. They are sources of trading signals.
Yellow lines indicate trend lines, trending channels, and any other technical patterns.
Indicator 1 on the COT charts shows the size of the net position for each category of traders.