Akcie společnosti Cordiant Digital Infrastructure Ltd. vzrostly o 1 % poté, co společnost zveřejnila aktuální výsledky hospodaření za devět měsíců končících 31. prosince 2024.
Aktualizace odhalila 9,6% nárůst celkových výnosů portfolia na 241,9 milionu GBP a 13,6% nárůst EBITDA na 115,6 milionu GBP, obojí na srovnatelné bázi, při konstantním měnovém kurzu.
Likvidní pozice společnosti zůstala stabilní s 211,7 milionu liber, proforma po nedávných refinancováních, zahrnující 78,3 milionu liber v hotovosti a 133,5 milionu liber v nevyčerpaných úvěrech. Hrubý dluh společnosti Cordiant činil 655,1 milionu liber, což představuje 37,8 % čistého dluhu k hrubé hodnotě aktiv (GAV), přičemž do června 2029 nehrozí žádná splatnost dluhu.
Dividendové krytí, využívající upravené prostředky z provozní činnosti (AFFO) za posledních dvanáct měsíců, bylo od mezidobí stabilní na úrovni 1,8násobku.
Analytici Jefferies si povšimli silného růstu EBITDA a zdůraznili, že pochází ze stávajícího portfolia a zatím neodráží akvizice společností DC United a BT Ireland.
„Celkový růst EBITDA zůstává silný, přičemž je důležité poznamenat, že se týká stávajícího portfolia a zatím nezahrnuje dopad akvizic DC United a BT Ireland,“ uvedli.
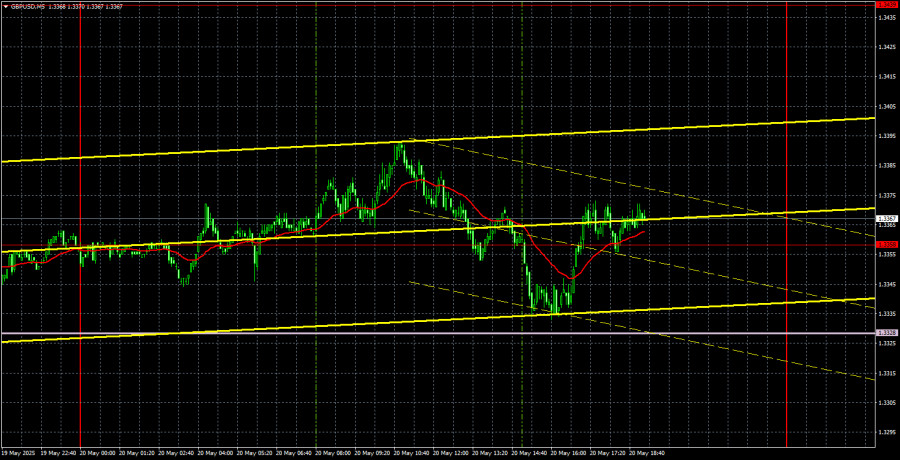
The GBP/USD currency pair continued to trade within the boundaries of a sideways channel on Tuesday, which has existed for over a month and is clearly visible. While on Monday the market had at least some formal reasons for intraday trend movement, on Tuesday, there were no such grounds at all. As a result, the entire day showed purely sideways movement. There is nothing to analyze from a fundamental or macroeconomic perspective. From a technical standpoint, the flat continues, and there is nothing more to add.
The Ichimoku indicator lines carry little significance within a flat range. While they can generate decent signals, most of them will be false. Therefore, trading is currently only advisable at the edges of the flat or when there are strong and accurate signals near levels and Ichimoku lines. For instance, the 1.3358 level is being ignored by traders simply because it, too, lies within the sideways channel.
On the 5-minute timeframe, we again did not mark any trading signals, as they were all subpar. Unfortunately, false signals are much more common within a flat than during a trend, so traders should exercise extreme caution when opening positions. What could cause the pound to break free from its current sideways range? We believe it could be significant and impactful news, or simply a sense of market fatigue with trading in a limited range. Predicting either scenario is difficult, so we must be patient and wait for now.
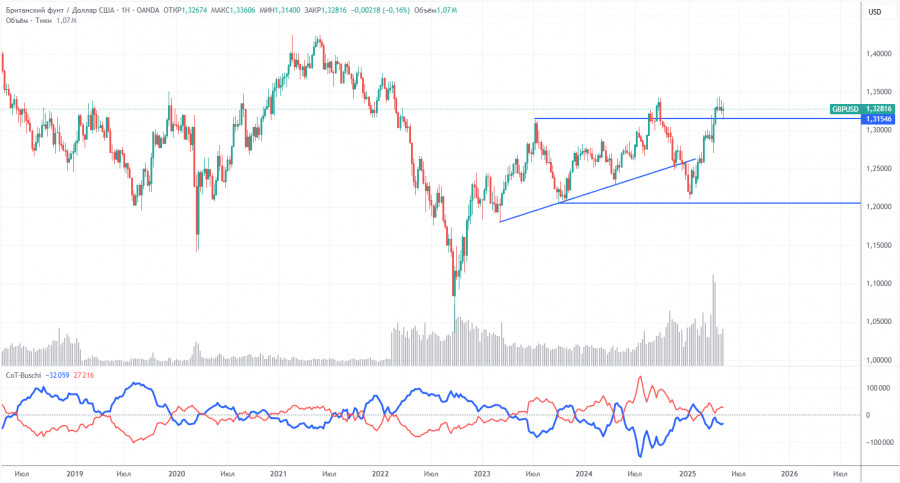
COT (Commitment of Traders) reports on the British pound show that commercial traders' sentiment has constantly shifted in recent years. The red and blue lines, representing net positions of commercial and non-commercial traders, frequently intersect and often stay close to the zero level. Currently, they are near each other again, indicating a roughly balanced number of long and short positions.
The dollar continues to decline due to Donald Trump's policies, so market makers' interest in the pound is not particularly relevant at the moment. If the global trade war continues to de-escalate, the dollar might have a chance to strengthen, but that chance still needs to be realized.
According to the latest report, the non-commercial group closed 4,800 long contracts and 2,800 short contracts. As a result, the net position of non-commercial traders declined by 2,000 contracts.
There are still no fundamental grounds for long-term purchases of the British pound, and the currency may continue its broader downtrend. The pound has recently risen sharply, mainly due to Trump's political influence. Once that factor fades, the dollar could regain strength. The pound has no independent reason to rise.
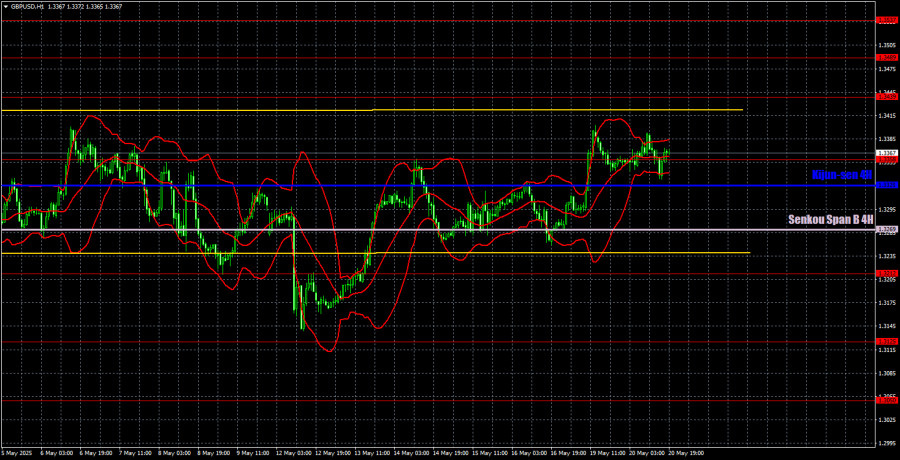
In the hourly timeframe, GBP/USD broke out of the sideways channel and began a downward movement. However, this move was short-lived, and it is safe to say the flat continues. Further movement depends entirely on Donald Trump and developments in the global trade war. If tensions continue to ease and trade agreements are signed, the dollar could resume growth. However, it must be noted that the market still does not favor the U.S. dollar, does not believe in the complete de-escalation of the trade conflict, and does not trust Trump.
For May 21, we highlight the following key levels: 1.2691–1.2701, 1.2796–1.2816, 1.2863, 1.2981–1.2987, 1.3050, 1.3125, 1.3212, 1.3288, 1.3358, 1.3439, 1.3489, 1.3537. The Senkou Span B line (1.3269) and the Kijun-sen line (1.3325) can also serve as signal sources. It is recommended to place a Stop Loss at breakeven once the price moves 20 pips in the right direction. The Ichimoku indicator lines may shift throughout the day, which should be considered when identifying signals.
For Wednesday, the UK is set to release the first somewhat interesting report of the week, on inflation. It is hard to say whether this publication has any real chance of pushing the pair out of its flat. Most likely, it does not. However, a sharp rise in inflation to 3.3% is expected, which traders could see as a reason to buy the British pound, as the Bank of England might be prompted to take a prolonged pause in easing monetary policy. The U.S. event calendar is empty on Wednesday.