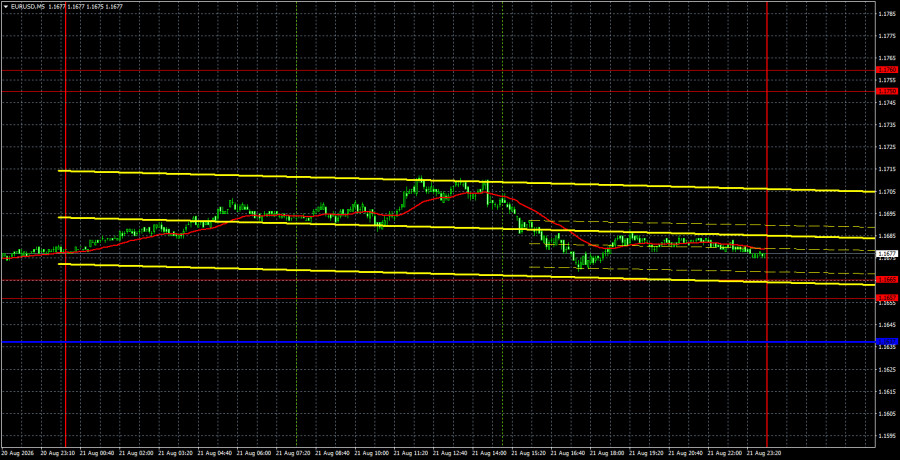
The EUR/USD currency pair once again failed to continue moving higher on Friday, but we do not observe a significant correction either. Instead, the price has left the market in a range between 1.1670 and 1.1712. Volatility has once again declined, and the market has begun to ignore all "second-rate" macroeconomic data. On Friday, business activity indices for the services and manufacturing sectors were published in Germany, the Eurozone, and the U.S. for the initial assessments for August. The German indices showed values of 48.5 and 54.1 points. The first index was weaker than the forecasts, while the second was stronger. The European indices showed values of 51.7 and 52.8 points, both of which were better than traders had expected. Thus, at least three of the four indices supported the European currency. This support was evident, with the market reacting to this data by pushing the euro up by 20 pips. In the second half of the day, U.S. business activity indices were released; they were objectively secondary, since the U.S. publishes its own internal ISM indices. Nevertheless, it is worth noting the rise of the services sector index to 56.8, which likely supported the dollar. Overall, volatility was around 40 pips, indicating very weak movements. True movements were only observed on Wednesday.
From a technical standpoint, the pair continues to form an upward trend, supported now by a trend line. The trend is not particularly strong, but let's remember that no global factors are currently favoring the U.S. currency. The only potential support could come from geopolitics, but even that is not shining at the moment. The dollar has been tossed a lifebuoy by the U.S. Treasury while receiving a 30-kilogram weight.
On the 5-minute timeframe, no trading signals were formed on Friday. Only in the evening did the price approach within 4 pips of the level of 1.1665, but even with a margin, entering the market before the weekend was hardly justified.
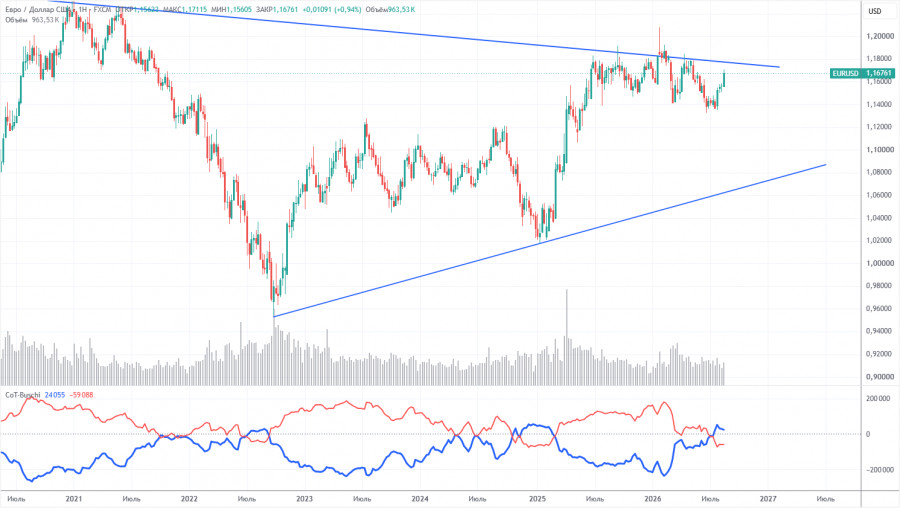
The latest COT report is dated August 18. The weekly timeframe illustration clearly shows that the net position of non-commercial traders has become "bearish" and has significantly decreased in 2026 due to geopolitical events. Traders have been shedding the European currency in favor of the U.S. dollar over the past few months. Trump's policy has not changed, but the dollar was for some time viewed as the "reserve currency."
We still see no fundamental factors that would strengthen the American currency. The war in the Middle East made the dollar temporarily super attractive, but once this factor "expires," everything will return to the way it was. And this process may have already concluded. In the long term, the euro could fall as low as $1.08 (the trend line), but the upward trend will remain relevant. In recent months of dollar growth, the pair has not moved significantly closer to this line.
The positioning of the red and blue lines of the indicator indicates parity between bulls and bears. During the last reporting week, the number of longs in the "Non-commercial" group decreased by 900, while the number of shorts decreased by 1,800. Consequently, the net position increased by 900 contracts over the week.
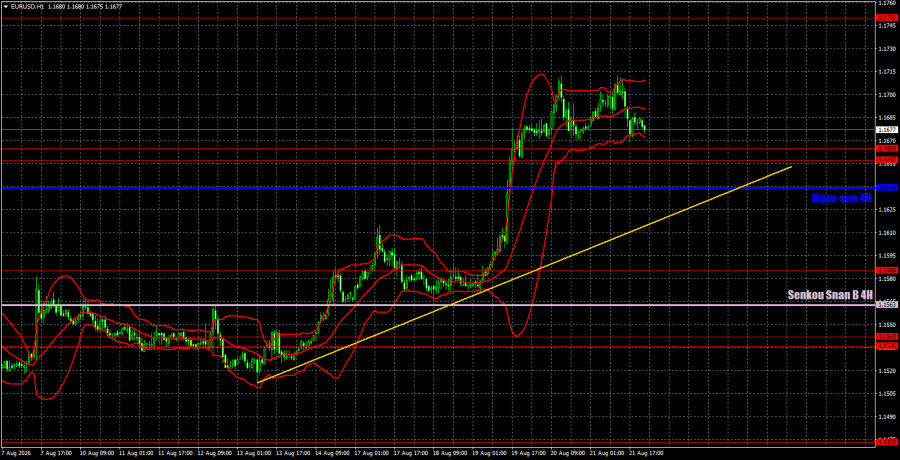
On the hourly timeframe, the pair maintains an upward trend. The situation in the Middle East remains tense and is not improving, but this is not enough for a new, powerful surge in the dollar. The market has been ignoring all positive factors for the euro in recent months and focusing solely on Federal Reserve monetary policy. Currently, however, the European currency has every chance for medium-term growth, while the dollar can only count on a technical correction and geopolitics.
On August 24, we highlight the following levels for trading — 1.1234, 1.1274, 1.1362-1.1368, 1.1461-1.1473, 1.1536-1.1542, 1.1585, 1.1657-1.1665, 1.1750-1.1760, 1.1786, 1.1830-1.1837, as well as the Senkou Span B line (1.1563) and the Kijun-sen (1.1639). The Ichimoku indicator lines may move throughout the day, which should be taken into account when determining trading signals. Do not forget to set a Stop Loss order at breakeven if the price moves in the correct direction by 15 pips. This will protect against potential losses if the signal proves false.
On Monday, there are no major events or publications scheduled in the Eurozone and the U.S. Therefore, traders will have nothing to react to throughout the day. Volatility on Monday may once again be weak.
Today, traders may consider short positions with targets at 1.1637 and 1.1585 if price settles below the 1.1657-1.1665 range. A settlement above the range of 1.1657-1.1665 allows for holding long positions with a target in the range of 1.1750-1.1760. A bounce from the range of 1.1657-1.1665 would allow for opening long positions.