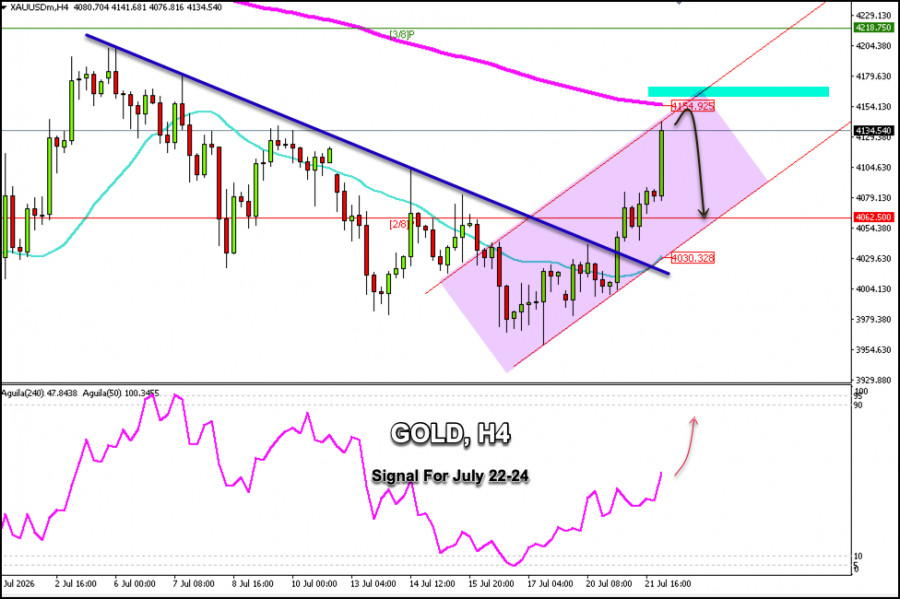
XAU/USD is currently trading at $4,132. The trend is positive following a breakout above the uptrend channel that had formed since early July. XAU is approaching the 200 EMA at $4,154, which could present an opportunity to open short positions.
On the H4 chart, we can see that gold managed to close the gap left on July 10 during today's Asian session. Technically, this was our target when the price broke above the 21-period simple moving average (SMA), as we mentioned in yesterday's analysis.
Gold could continue its rise in the coming hours. If a technical correction occurs toward $4,062 or $4,085, we would expect these levels to act as solid support for opening long positions, with targets in the coming days of up to the 3/8 Murray level, around $4,218.
On the H4 chart, we can see the highs from June 2, around $4,200. If gold continues to rise and breaks above $4,154 (200 EMA) in the coming hours, this could be considered an opportunity to open short positions, as it also coincides with the daily R3, and a technical correction below this zone is expected.
The Eagle indicator is showing a positive signal, so as the price consolidates above the Murray 3/8 level in the coming days, any pullback will be viewed as an opportunity to continue buying.