USD/JPY
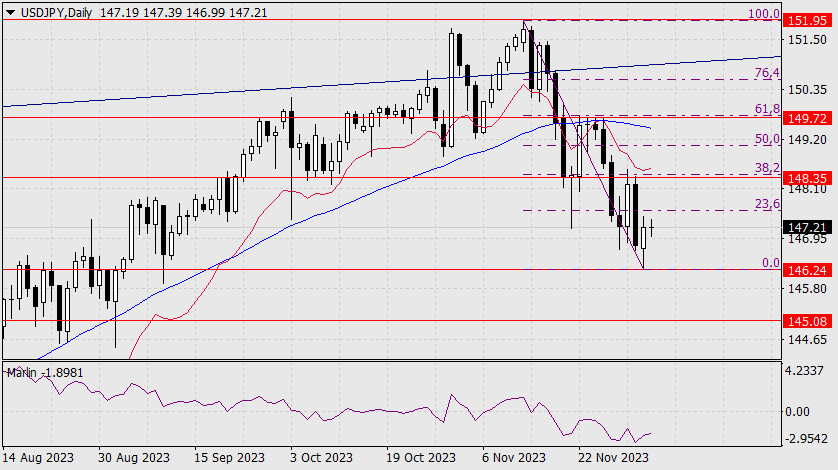
Yesterday, the USD/JPY pair fell with the Marlin oscillator rising. This was likely the pair's last movement before an upcoming corrective rise. If so, the price has formed a new support level at 146.24.
Rising towards the first resistance at 148.35 would correspond to a 38.2% Fibonacci retracement. Further growth to 149.72 (the peak on November 24) would correspond to a 61.8% retracement. If the price manages to continue its downward movement, breaking below 148.24, it may aim for 145.08 (the peak on June 30).
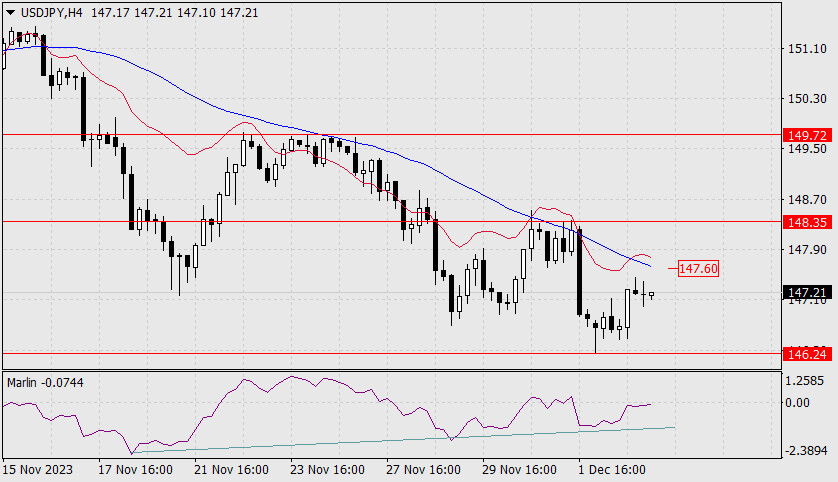
On the 4-hour chart, the price and Marlin oscillator have formed a double convergence. If the price rises above the MACD line (147.60), also corresponding to breaking above the 23.6% Fibonacci level on the daily chart, the nearest bullish target would be 148.35. Consolidation above this level means that the next target will be 149.72.