Monthly chart
On the monthly time frame, there is a strong upward trend and there is no indication of weakness in this trend, so this upward movement is expected to continue. In the past two months, the currency pair went through some downward corrections. These corrections will likely end this month and USD/JPY may rebound from the current levels.
Weekly chart
Almost the same thing applies to the weekly time frame, as the price has bounced from a good order block area. Besides, the instrument has bounced from it previously. So, it is expected that if a weekly candle closes above this area, it may bounce from it during the next two weeks.
Daily chart
The only opportunity on the daily time frame is to wait for the price to fall to the order block zone and possibly break the wick that was previously formed at the level of 141.676 and then rise after that. The purpose of this break is to collect liquidity to complete the rise. USD/JPY may also rise without the need to break this level.
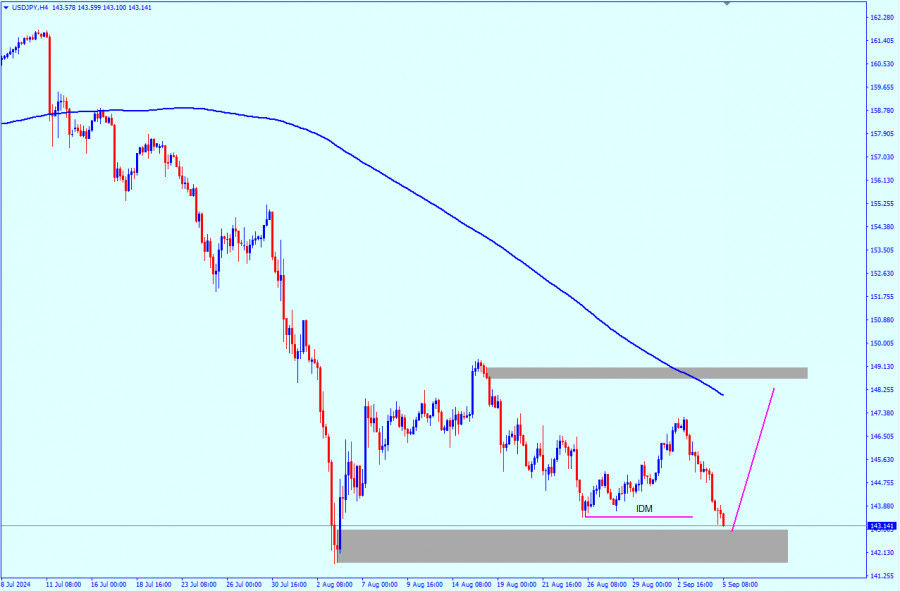
H4
Since the pair has dropped by many pips during the week, it is possible to see some upward corrections in case it wants to reach the daily order block and then continue the rise. Alternatively, if it rises from the current level, the odds are that the price will rebound from the order block on the four-hour chart from the level of 142.98.
Points of interest (POI)
Buy from: 142.98 (with conformation signal only)
TP 1: 146.650
TP 2: 148.64
Stop loss: 141.74 (below the OB)
Economic news
There will be crucial news on the NFPs at the end of this week, so I strongly recommend putting a stop loss at the entry zone before the news release.