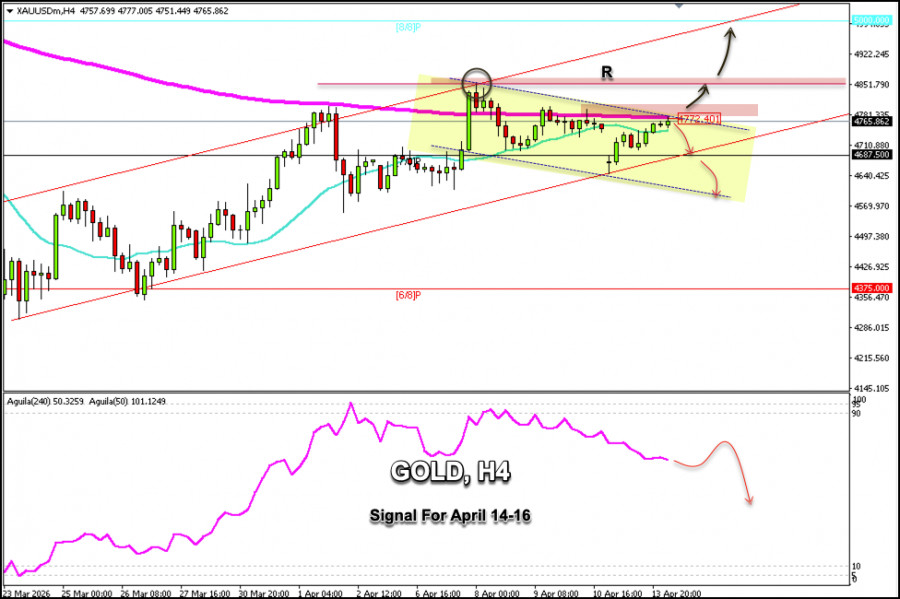
Gold is trading around $4,765, below the 200-day EMA and above the 21-day SMA, with a bullish bias. Having fully closed the gap, the instrument is now consolidating above $4,750, so it is likely to continue rising in the coming days.
Given that gold is under downward pressure and showing signs of being overbought, only a consolidation above $4,780 could alleviate the downward pressure and could mark the start of a new uptrend in which the metal could reach $4,850 and even the psychological level of $5,000.
If gold fails to consolidate above $4,800, we could view this area as a signal to sell below the 200 EMA with a target at $4,715. We could even expect it to find strong support around the 7/8 Murray line, which coincides with the lower band of the uptrend channel around $4,687.
If gold falls below the 7/8 Murray line and below the uptrend channel, it could signal a strong bearish move and could reach the 6/8 Murray line around $4,375 in the coming days.
The Eagle indicator is showing a negative signal, so we believe that any approach to daily or weekly resistance levels could be considered a zone to open short positions.