Evropské akcie v pondělí rostly, protože investoři se připravovali na údaje o podnikatelské aktivitě z některých největších ekonomik v regionu a zároveň čekali na vyjasnění situace ohledně amerických cel.
Panevropský index STOXX 600 byl do 08:05 GMT o 0,6 % výše, k čemuž přispěly zisky akcií těžebních společností, které posílily o zhruba 2,6 % díky vyšším cenám mědi.
Banka JP Morgan rovněž dvakrát zvýšila doporučení pro evropský těžební sektor na „overweight“ z „underweight“.
Index STOXX 600 minulý týden po dvou po sobě jdoucích týdenních ztrátách vzrostl, protože Německo dalo konečnou zelenou masivnímu nárůstu půjček, které mají podpořit růst největší ekonomiky regionu.
Investoři čekají na podrobnosti o slibu amerického prezidenta Donalda Trumpa, že 2. dubna uvalí reciproční cla na mnoho zemí.
Co se týče ekonomických údajů, v pondělí budou zveřejněny bleskové průzkumy PMI z Francie, Německa a eurozóny.
Akcie společnosti Bayer se propadly o 6,6 % poté, co porota v USA nařídila výrobci osiv a pesticidů zaplatit přibližně 2,1 miliardy dolarů žalobci, který tvrdil, že mu přípravek na hubení plevele Roundup od této společnosti způsobil rakovinu.
The EUR/USD currency pair mostly traded sideways throughout Tuesday. Unlike Monday, traders had no formal reason to sell the dollar, something they've been doing frequently lately. As a reminder, Monday's drop in the USD was triggered by news of a U.S. credit rating downgrade and increased purchases of government bonds by the Federal Reserve. These were relatively formal reasons, but the market is currently grabbing any excuse to sell the U.S. currency.
Not even those formal reasons were present on Tuesday — yet the dollar again failed to rise, even with an empty economic calendar. Meanwhile, the euro continues to rise regularly under the same conditions. This again highlights that even the de-escalation of the trade war isn't supporting the dollar as it should.
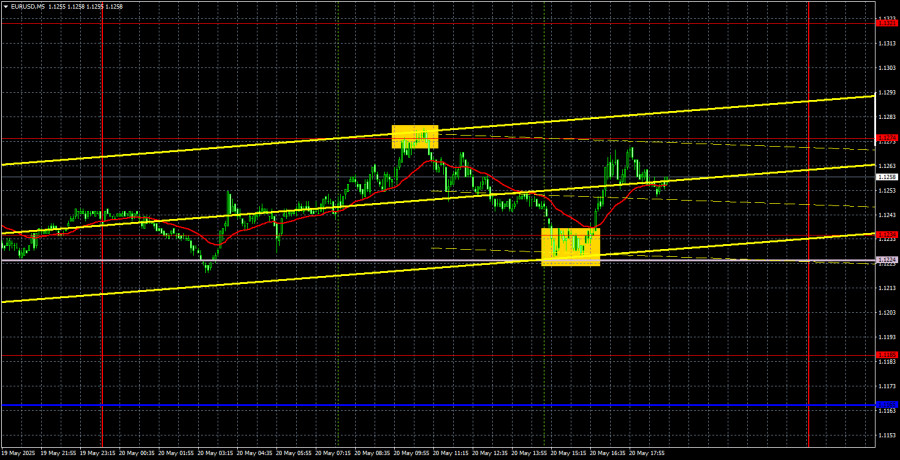
An ascending trendline has formed, and the U.S. currency will only be expected to strengthen if the price consolidates below this line. Additionally, price has consolidated above the Ichimoku indicator lines, signaling the emergence of a new bullish trend.
Despite being flat throughout the day, the pair generated two solid trading signals. First, it bounced precisely off the 1.1274 level, and then it rebounded from the 1.1224–1.1234 area. In both instances, traders had sufficient grounds to enter the market due to the accuracy of the signals. Volatility was relatively low, so the total profit across both trades was around 40–50 pips.
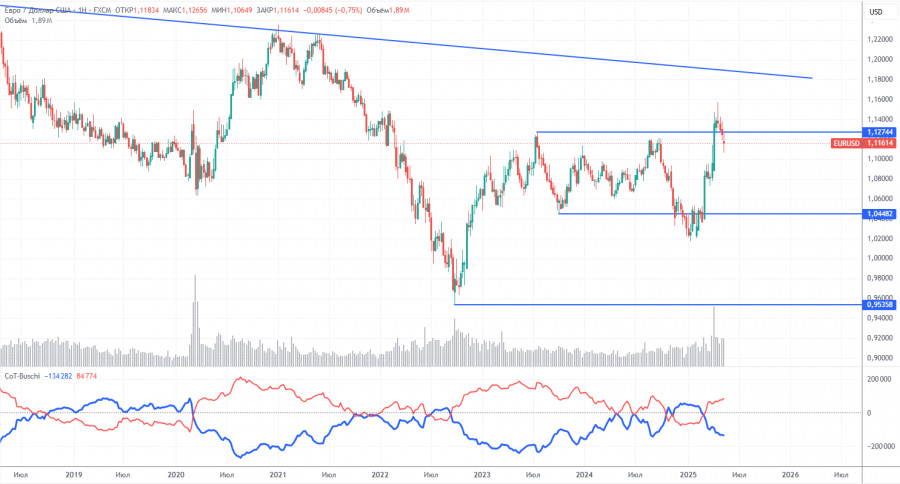
The most recent Commitment of Traders (COT) report is dated May 13. As the chart above illustrates, the net position of non-commercial traders has long remained bullish. Bears briefly overtook but quickly lost control. Since Trump took office, the dollar has been falling sharply. While we can't guarantee that this decline will continue indefinitely, COT reports reflect the sentiment of major market players, though in current circumstances, that sentiment can shift quickly.
There are no fundamental reasons for the euro to strengthen, but the dollar faces a significant political burden. EUR/USD may continue to correct for several more weeks or months, but the broader 16-year downtrend won't reverse so quickly. Once Trump's trade wars end, the dollar may resume its upward trend.
The red and blue lines on the COT chart have crossed again, signaling a renewed bullish trend. During the last reporting week, the number of long positions from non-commercial traders increased by 15,400, while shorts rose by 6,300. As a result, the net position grew by 9,000 contracts.
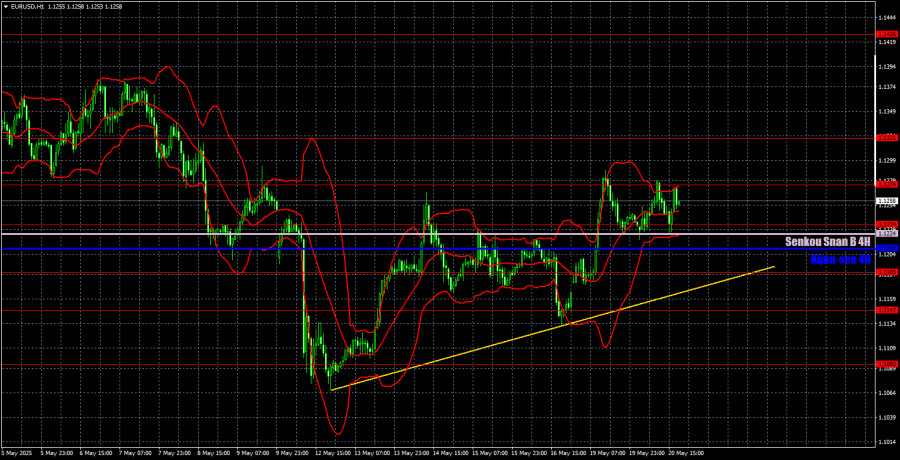
In the hourly timeframe, EUR/USD is attempting to resume its upward trend, having consolidated above the Ichimoku lines. The dollar's outlook still depends heavily on developments in the global trade war. If agreements are signed and tariffs reduced, the USD may recover further. However, at this point, a downward reversal would require a break below both the Ichimoku lines and the trendline. While the dollar still has room for growth, its prospects are weak due to the market's continued reluctance to deal with Trump's currency.
For May 21, we highlight the following levels for trading: 1.0823, 1.0886, 1.0949, 1.1006, 1.1092, 1.1147, 1.1185, 1.1234, 1.1274, 1.1321, 1.1426, 1.1534, as well as the Senkou Span B (1.1224) and Kijun-sen (1.1209) lines. Ichimoku lines can shift throughout the day, so traders should monitor them closely when evaluating trading signals. As always, set a Stop Loss to breakeven once price moves 15 pips in the correct direction — this will protect against false signals.
No significant reports or events are scheduled in the U.S. or the Eurozone on Wednesday. Thus, traders should not expect any market-moving headlines. Monday demonstrated that even minor news can lead to significant dollar fluctuations; however, such news is not a daily occurrence. As a result, low volatility and sideways movement are likely to continue for another day.