The EUR/USD currency pair once again showed an intention to rise a bit after two weeks of decline. However, the result was poor again, despite the dollar having almost no other supporting factors besides the Iranian situation, which the market seems to have been pricing in for two weeks. Nevertheless, the price broke the descending trend line for the third time. Will this be enough to change the trend to upward? In our view, given current realities, the price could reach the Senkou Span B line, but the trend's future will depend on the strongest line of the Ichimoku indicator.
The macroeconomic background on Wednesday was absent. Yes, Germany released a report on GDP for the fourth quarter in its third estimate, and the Eurozone released the inflation report for January in its second estimate. However, these estimates were no different from the previous ones or forecasts. Therefore, traders had nothing to react to throughout the day. In the U.S., the calendar of events was empty, and the latest news from across the ocean did not interest traders. Thus, hope now rests solely on the technical picture, which suggests growth for the pair.
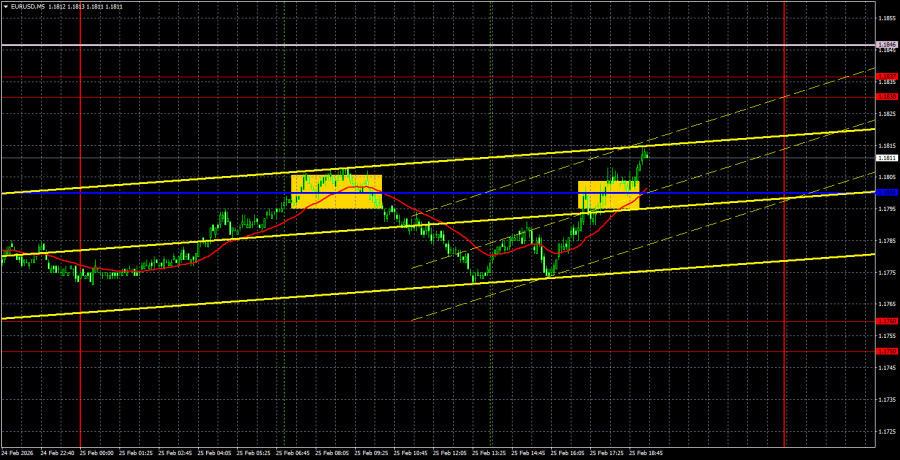
On the 5-minute timeframe, two very imprecise trading signals were generated yesterday. During the European trading session, the price bounced off the Kijun-sen line and then dropped about 20 pips. Following that, there was a breakthrough of the critical line, which occurred practically at the end of the entire movement, considering the low volatility. Of course, the price could continue to rise on Thursday, but the signal has not improved. However, none of them caused a loss.
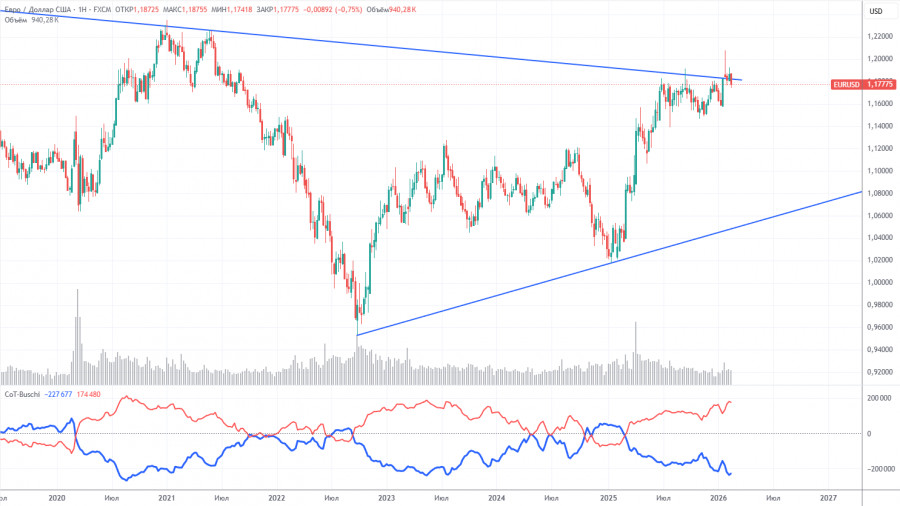
The latest COT report is dated February 17. The weekly timeframe illustration shows that the net position of non-commercial traders remains "bullish." Since Trump assumed the presidency of the United States for the second time, only the dollar has been falling. We cannot say with 100% certainty that the decline of the American currency will continue, but current developments around the world suggest this is a possibility.
We still do not see any fundamental factors that would strengthen the euro; however, there are enough factors indicating a decline in the American currency. The global downward trend is still in place, but what does it matter where the price moved in the last 18 years? A new upward trend has been forming over the last three years, and the global downward trend line has been broken. Thus, the path further north is open.
The positioning of the red and blue lines of the indicator continues to indicate the maintenance of a "bullish" trend. Over the last reporting week, the number of longs for the "Non-commercial" group decreased by 7,100, while the number of shorts decreased by 1,300. Consequently, the net position decreased by 5,800 contracts over the week.
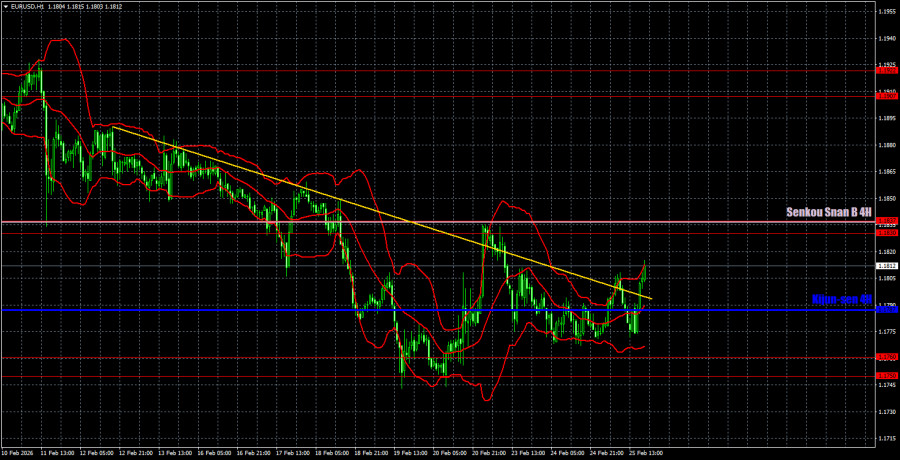
On the hourly timeframe, the EUR/USD pair has potential to rise, but it needs to consolidate above the Senkou Span B line. The pair left the sideways channel of 1.1400-1.1830 at the beginning of the year, where it spent seven months, so the global upward trend has officially resumed. However, in the last two weeks, we have seen another surprising rise in the U.S. dollar. Now we need the trend to change to an upward movement on the hourly timeframe.
For February 26, we highlight the following levels for trading: 1.1362, 1.1426, 1.1542, 1.1604-1.1615, 1.1657-1.1666, 1.1750-1.1760, 1.1830-1.1837, 1.1907-1.1922, 1.1971-1.1988, 1.2051, and 1.2095, as well as the Senkou Span B line (1.1837) and Kijun-sen (1.1787). The lines of the Ichimoku indicator may shift during the day, which should be taken into account when determining trading signals. Don't forget to set a Stop Loss order to break even if the price has moved in the right direction by 15 pips. This will protect against potential losses if the signal turns out to be false.
On Thursday, a report on jobless claims is scheduled for release in the U.S., and Christine Lagarde will be speaking in the Eurozone. Theoretically, Lagarde may provide the market with important information, but expectations are quite low. The ECB's current monetary policy raises no questions.
On Thursday, traders may consider selling with targets of 1.1750-1.1760 in the event of another bounce from the 1.1830-1.1837 area. Long positions may be considered with a target of 1.1907-1.1922 if the Senkou Span B line is overcome.