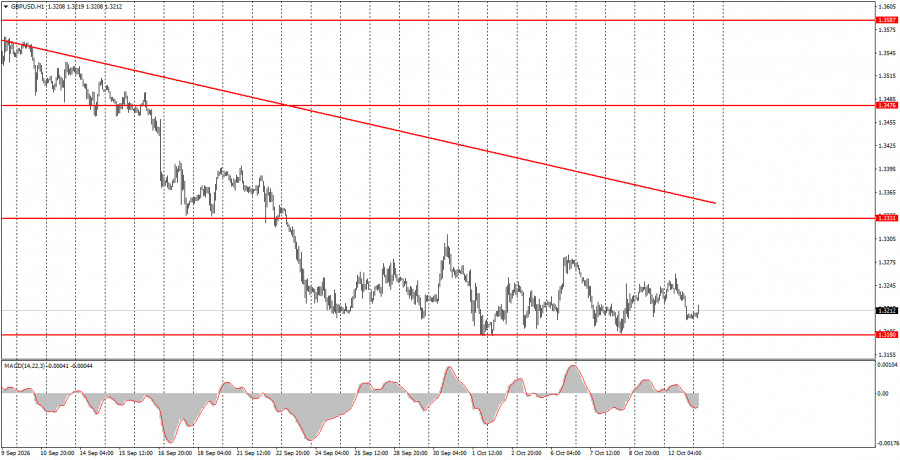
The GBP/USD pair also moved lower on Monday, but overall the pound has traded in a sideways channel for more than two weeks. As a result, the pound has found support and may begin forming a new upward trend from this area. However, that requires the euro to finish its downtrend. Without euro strength, the pound will also struggle to rise. Expecting euro growth is difficult when its price falls almost daily for no clear reason. One can invoke "rising risk-off sentiment" or "increasing geopolitical tension," but such explanations are unlikely to satisfy after a month of uninterrupted euro weakness. On Monday, nothing important happened in the US or the UK. This week, traders are mainly focused on the US inflation report, but even that figure is unlikely to radically change market sentiment. If the market is intent on buying more dollars regardless of news, what will change the Consumer Price Index?
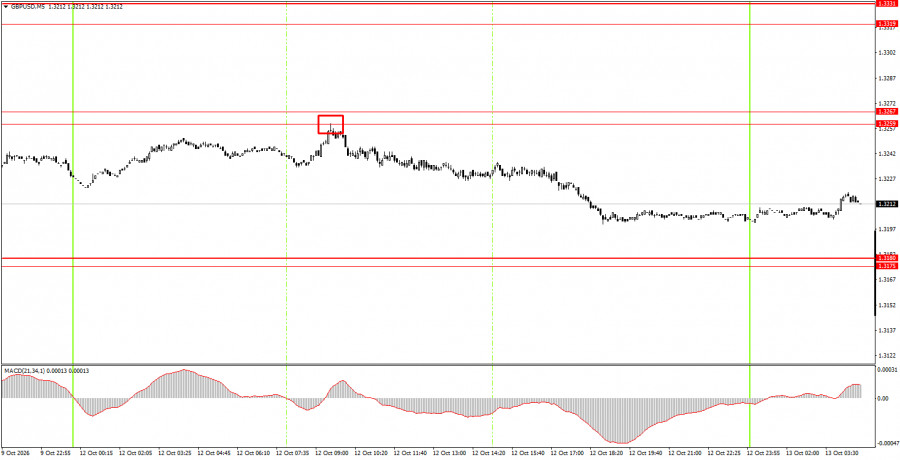
On the 5-minute timeframe on Monday, one sell trading signal was formed. During the European session, price reacted precisely to the 1.3259 level, bounced off it, and allowed traders to open short positions. By the end of the day, the pound lost about 40 pips, which traders could have captured as profit.
On the hourly timeframe, GBP/USD continues a downward trend that has become a full, powerful trend. The fundamental backdrop for the dollar improved after the Federal Reserve signaled readiness to begin monetary tightening. However, three weeks have passed since then, and the market continues to buy the dollar aggressively. Therefore, we strongly doubt that the dollar's strength is solely due to Fed policy. We view the current move as illogical, inertia-driven and speculative.
On Tuesday, novice traders may consider short positions targeting 1.3096–1.3107 if price closes below the 1.3175–1.3180 area. Open long positions with a target of 1.3259–1.3267 if price rebounds from the 1.3175–1.3180 area.
On the 5-minute timeframe, traders can watch the levels 1.3043, 1.3096–1.3107, 1.3175–1.3180, 1.3259–1.3267, 1.3319–1.3331, 1.3380–1.3386, 1.3456–1.3476, 1.3587–1.3598, 1.3631–1.3641. On Tuesday, no major events are scheduled in the UK or the US, so traders will again have little to react to during the day. We do not expect high volatility, and the pound sterling will most likely remain in sideways movement.
Price levels (areas) of support and resistance serve as targets for opening buy or sell trades or as sources of signals.
Red lines indicate channels or trend lines that show the current trend and the preferred trading direction.
The MACD indicator (14,22,3) — the histogram and signal line — is an auxiliary indicator that can also provide signals.
Important speeches and reports (listed in the news calendar) can significantly influence currency pair movements. Therefore, during their release, traders should approach trading with utmost caution, or exit the market to avoid sudden reversals against the preceding move.
Beginner forex traders should remember that not every trade can be profitable. Developing a clear strategy and practicing money management are key to long-term success in trading.