Bitcoin zaznamenal největší jednodenní procentuální ztrátu od listopadu 2022, když se propadl o 10,10 % a na indexu Investing.com se obchodoval za 65 940,0 USD. Tento pokles snížil tržní kapitalizaci Bitcoinu na 1 320,0 miliardy dolarů, což představuje 51,81 % celkové tržní kapitalizace kryptoměn. Za posledních 24 hodin se kryptoměna pohybovala v rozmezí 65 765,6 až 72 398,1 USD. Za uplynulý týden se hodnota bitcoinu změnila jen málo a vzrostla pouze o 0,36 %. Objem obchodů s bitcoinem za uplynulý den činil 77,9 miliardy dolarů, což představuje 38,57 % celkového objemu všech kryptoměn. Navzdory tomu zůstává Bitcoin 10,58 % pod svým historickým maximem 73 740,90 USD stanoveným 14. března. Ethereum rovněž zaznamenalo pokles o 9,74 % a dosáhlo hodnoty 3 591,53 USD na indexu Investing.com. Mezitím Tether USDt zaznamenal pouze mírnou ztrátu 0,02 % a obchodoval se za 0,9990 USD. Tržní kapitalizace Etherea činí 440,3 miliardy USD, což představuje 17,28 % celkové tržní kapitalizace kryptoměn, zatímco tržní kapitalizace Tether USDt dosáhla 103,2 miliardy USD, což odpovídá 4,05 % celkové tržní hodnoty kryptoměn.
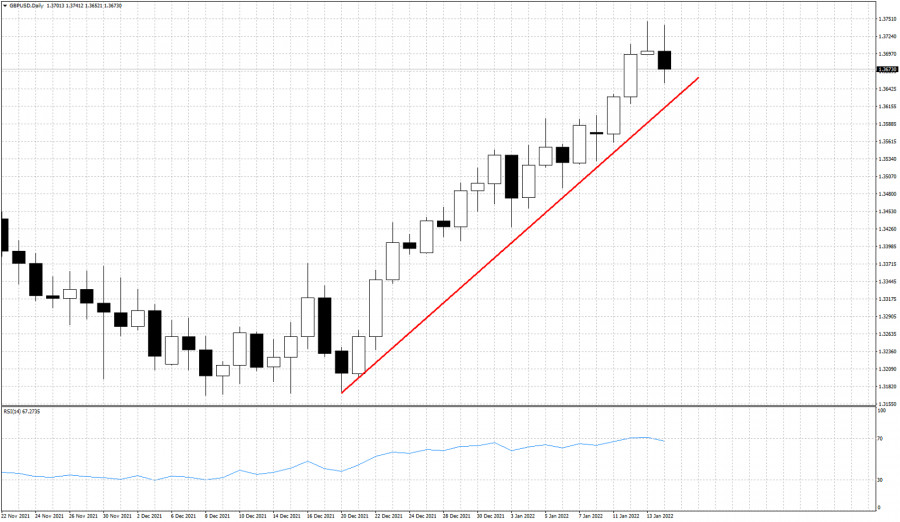
GBPUSD has reached as high as 1.3747 yesterday and 1.3741 earlier today. Price got rejected at recent highs and is now lower than yesterday. Yesterdays candlestick pattern is a bearish hammer formation indicating increased chances of a bearish reversal.
Technically trend remains bullish as price continues making higher highs and higher lows. Price continues to respect the upward sloping support trend line, but with the RSI turning lower from overbought levels combined with a bearish hammer pattern, as we said before, at current levels we prefer to be neutral if not bearish. I believe the upside potential is very limited.