
The economic calendar was traditionally empty on Monday. No important reports were published in the EU, the United Kingdom, and the United States. But do not be discouraged as things may change in the middle of the week on the results of the Fed, ECB and the Bank of England meetings, EU inflation, and the U.S. Department of Labor report. Thus, we expect high volatility in the financial markets.
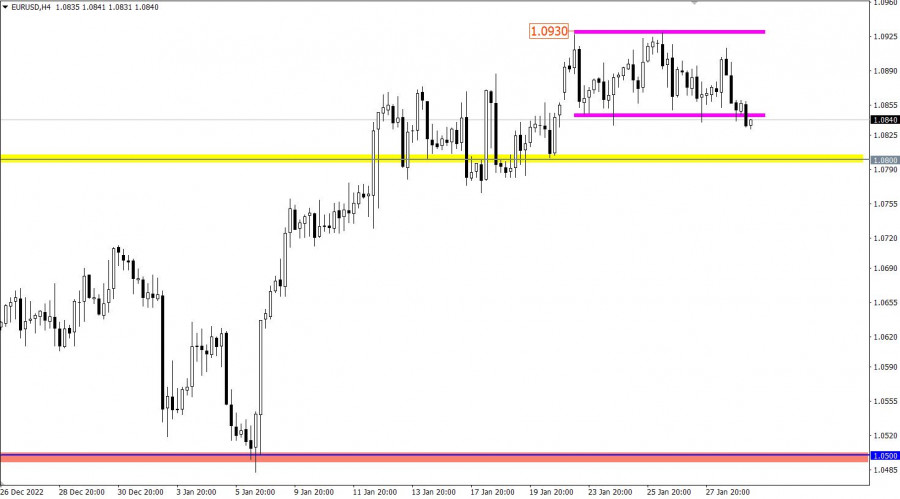
For the first time since the formation of the current flat, the EURUSD currency pair was below 1.0835, which may indicate a bias in trading forces in favor of sellers. However, there is no confirmation of this theory yet.
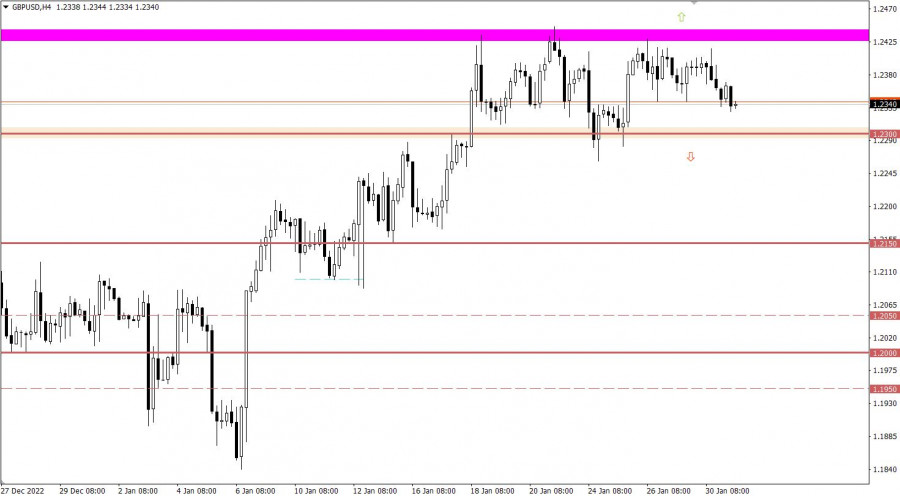
Despite the fact that the new trading week started with a decline in the value of the GBPUSD pair, the quote is still within the 1.2300/1.2440 sideways channel.
Today, data on the lending market in the UK will be released, where not the most positive figures are expected, which may put pressure on the value of the pound sterling if they coincide.
Approved mortgages may reach 45,000 from the previous month's 46,100. The volume of mortgage lending may amount to 4.0 billion pounds against 4.4 billion pounds in the previous month. Recall that mortgage lending is directly related to the real estate market, which is an important sector of the British economy.
Tuesday's main event is the preliminary estimate of the eurozone GDP for the fourth quarter. Economic growth is expected to slow down from 2.5% to 1.6%. The slowdown in economic growth is a negative factor that could put pressure on the euro.
Time targeting:
UK lending market – 09:00 UTC
EU GDP – 10:00 UTC
ECB press conference – 13:45 UTC
Despite the initial technical signal to sell the euro, the quote is still near the lower border of the flat 1.0840/1.0930. Thus, the return of the price above the value of 1.0850 allows the restart of long positions, which would make the current breakdown false.
Presumably, market participants have targeted the lower border of the flat during the downward cycle. The next move will depend on the price behavior within the value of 1.2300, as the main tactics, at this time, are the rebound and breakout methods relative to the boundaries of the flat.
Let's concretize the above:
The downward move will be relevant if the price holds below the level of 1.2300 in a four-hour period. This step can lead to the formation of a full-blown correction.
The upward move is taken into account in case of a stable holding of the price above the value of 1.2450 in a four-hour period. This move will indicate a continuation of the upward trend.
The candlestick chart type is white and black graphic rectangles with lines above and below. With a detailed analysis of each individual candle, you can see its characteristics relative to a particular time frame: opening price, closing price, intraday high and low.
Horizontal levels are price coordinates, relative to which a price may stop or reverse its trajectory. In the market, these levels are called support and resistance.
Circles and rectangles are highlighted examples where the price reversed in history. This color highlighting indicates horizontal lines that may put pressure on the asset's price in the future.
The up/down arrows are landmarks of the possible price direction in the future.