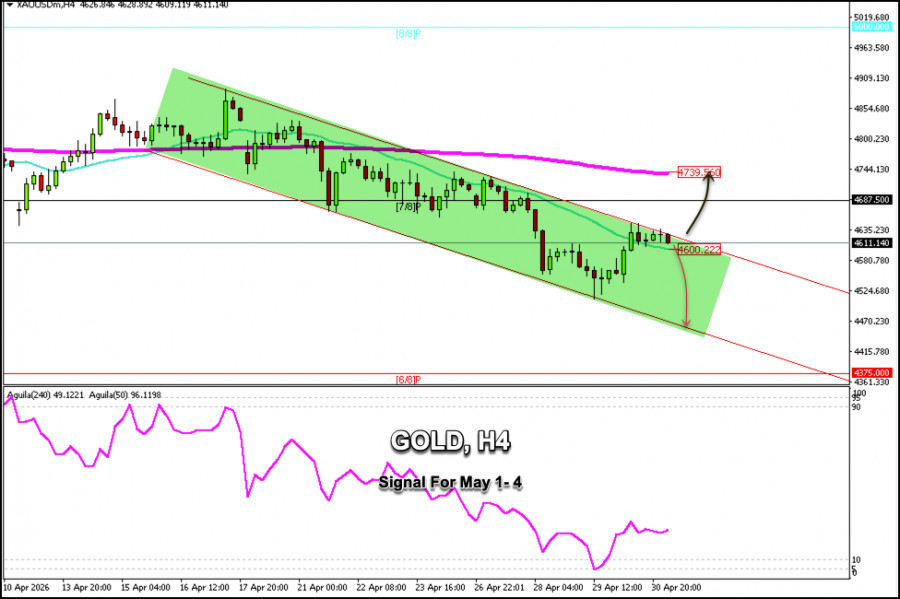
Gold is trading around $4,611 after several unsuccessful attempts to break out of the downtrend channel, and it is expected to continue falling toward the lower band of the downtrend channel, around $4,450, in the coming days.
If gold consolidates above $4,600 and decisively breaks out of the downtrend channel in the coming hours, we could expect it to continue rising, which could be seen as a positive signal to buy, with targets at the 7/8 Murray level around $4,687. Ultimately, we expect it to reach the 200 EMA around $4,739.
A pullback to the 61.8% Fibonacci level around $4,780 could be considered a bearish signal, and we could open long positions if the price encounters rejection below the 200 EMA.
Conversely, a drop below $4,600 could be seen as a resumption of the bearish cycle, and we could sell gold with targets at $4,500 and $4,470 near the lower band of the bearish trend channel.