Scheduled Maintenance
Scheduled maintenance will be performed on the server in the near future.
We apologize in advance if the site becomes temporarily unavailable.
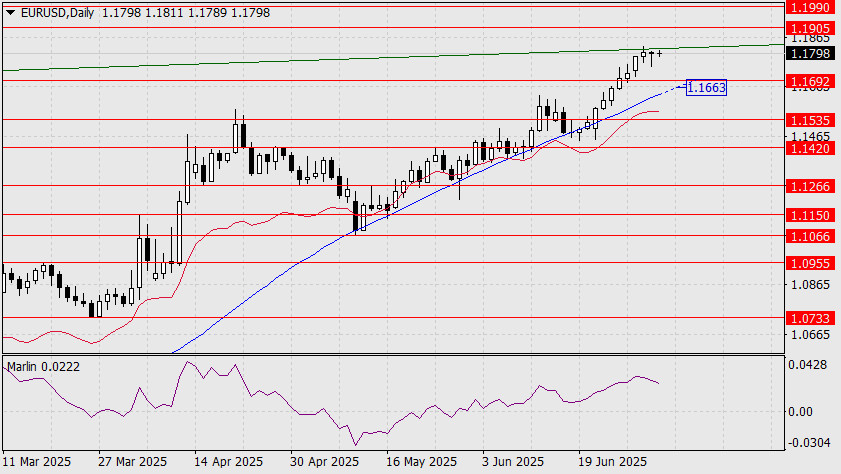
Ahead of today's U.S. employment data release for June, the euro consolidated near the price channel line on the daily chart. The long lower shadow of the candlestick suggests that market participants were inclined to buy the euro, especially as all preliminary labor data have been pointing in that direction. For example, ADP private sector employment showed a decline of 33,000, versus a forecasted increase of 99,000, and the May figure was revised downward from 37,000 to 29,000.
The forecast for Nonfarm Payrolls is 120,000, down from 139,000 in May, while the unemployment rate is expected to rise from 4.2% to 4.3%. We do not expect stronger figures, as the number of unemployed people has been increasing on a weekly basis. However, there is a significant caveat – the data can easily be "adjusted" in a more favorable direction. This kind of data manipulation was widely used from 2007 to 2015, likely with the sole purpose of regulating the market.
We now await the data release. Upside targets: 1.1905, 1.1990. Downside targets: 1.1663/92, 1.1535. It's worth noting that an increase in the euro does not necessarily open up prospects for the continuation of the medium-term uptrend, whereas a decline and consolidation below the MACD line would likely reverse the trend (target: 1.1066). The Marlin oscillator indicates bullish weakness.
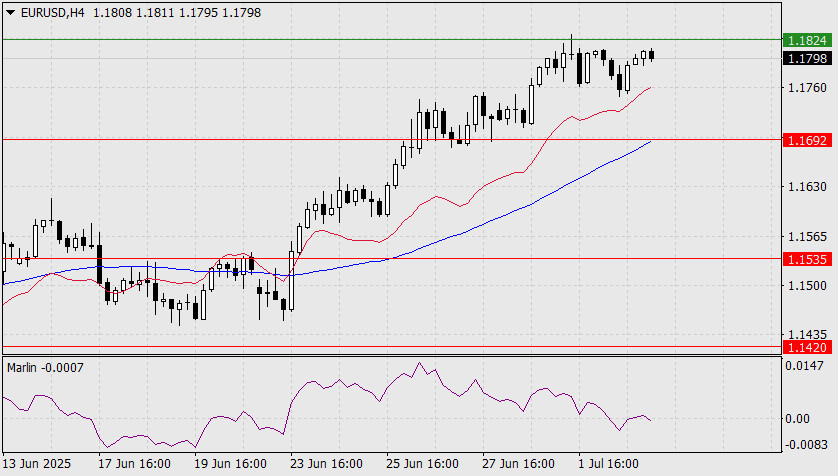
On the H4 chart, this weakness is more clearly visible: Marlin is almost fixed in negative territory. We await further developments.
Scheduled maintenance will be performed on the server in the near future.
We apologize in advance if the site becomes temporarily unavailable.