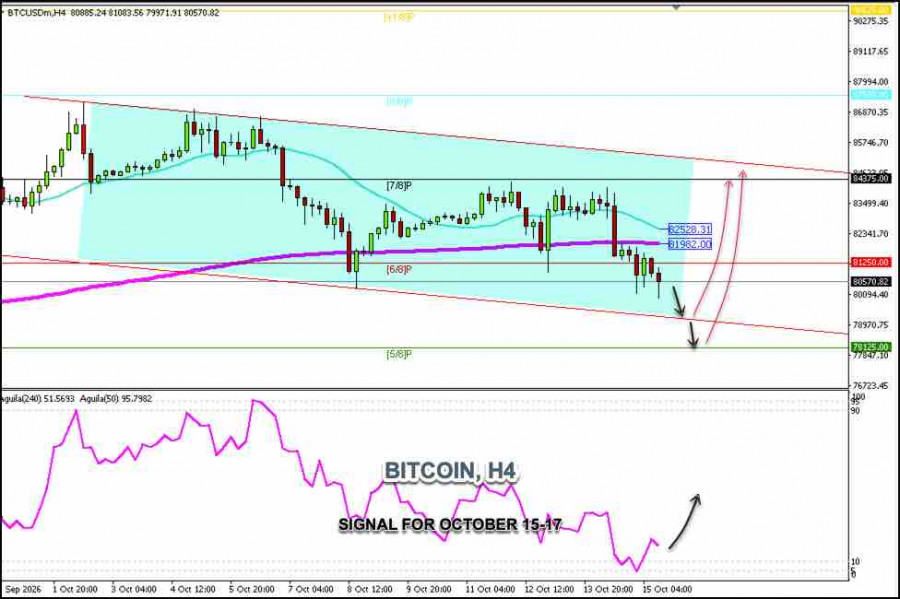
Bitcoin is trading around $80,570 after reaching the psychological level of $80,000 and even surpassing the October 8 low. Consolidation around this area is likely in the coming days.
Bitcoin made several attempts to break above the 7/8 Murray level but failed. During the US trading session, when the price fell below the 21 SMA, a sharp downward acceleration followed after positive US economic data, which added pressure on Bitcoin.
Currently, BTC is consolidating below the 200 EMA and below the 6/8 Murray line, suggesting that further downside may follow in the coming days.
Looking at the H4 chart, we can see that Bitcoin has reached oversold levels, as the Eagle indicator is in the 10 zone, signaling a positive trend.
This supports the view that Bitcoin could recoup some of its losses in the coming days, so we should keep a close eye on price action. If BTC consolidates above the psychological level of $80,000, that could be viewed as a buying opportunity.
If bearish momentum prevails, Bitcoin is expected to find strong support near the lower band of the downtrend channel around $78,900 and potentially around the 5/8 Murray level at $78,125.
Consolidation above $80,000 would generate a buy signal with targets at 81,250, the 200 EMA around 81,982, and ultimately the upper band of the downtrend channel around $84,600.