A decisive break above the uptrend channel and consolidation above the 200-day exponential moving average (EMA) could change the outlook for gold, and we could expect it to reach
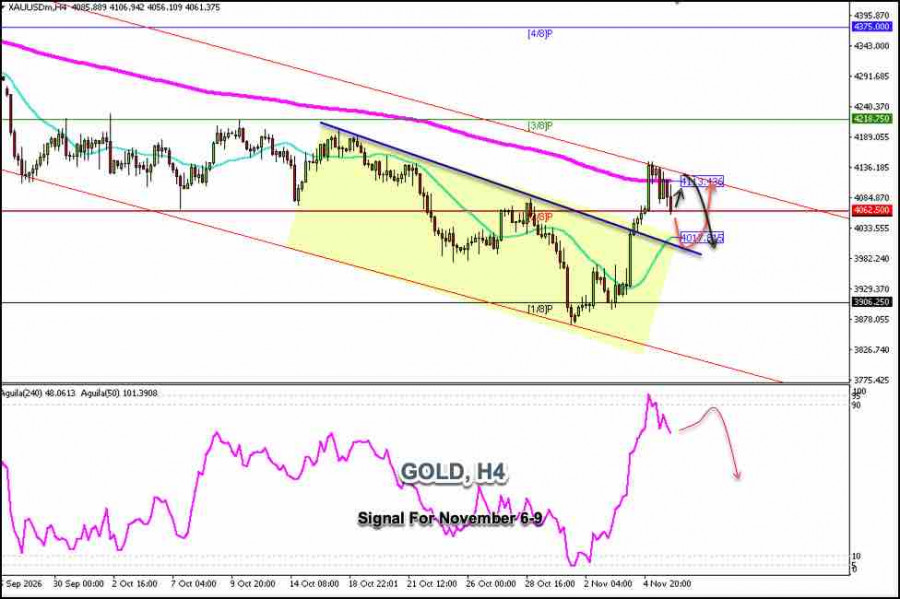
Gold is trading around $4,061 after reaching a high of $4,145, which coincided with the upper band of the downtrend channel.
From a technical perspective, we expect gold to resume its uptrend and move closer to the 200-day exponential moving average (EMA), currently at $4,113.
If gold tests the Murray 6/8 level and consolidates above this zone in the coming hours, it could be interpreted as a positive signal to buy above $4,062, with targets at $4,120.
A decisive break above the uptrend channel and consolidation above the 200-day exponential moving average (EMA) could change the outlook for gold, and we could expect it to reach the Murray 3/8 level, around $4,218.
On the other hand, given that US nonfarm payrolls will be released during the US trading session, we expect this to impact gold; we could see it retest the strong resistance levels of $4,120 or $4,145. If gold fails to break above this zone, it could be interpreted as a sell signal; conversely, if gold falls below $4,062, it could reach the psychological level of $4,000.
One opportunity to sell XAU/USD would be to wait for gold to reach the upper band of the downtrend channel before opening short positions; conversely, a good point to open long positions would be to wait for the price to continue falling until it finds solid support around the daily S_2 or S_3 levels, located at $3,980.
The Eagle indicator has reached extremely overbought levels. From a technical perspective, a technical bounce from the Murray 6/8 level toward $4,120 or $4,218 could be considered a signal to open short positions in the coming days.
Importantly, gold left a gap around $3,873. From a technical perspective, we believe it could return to that level in the coming days if the price falls below the psychological level of $4,000.