
Donald Trump took office for a second term in January 2025, promising to reduce the U.S. national debt, cut the budget deficit, address immigration issues, and revive American manufacturing. His campaign was powerful and full of grand promises — pledging a "Golden Age" for the American people. Nine months into his presidency, it's time to assess the early results.
The U.S. economy is showing mixed signals. In the first quarter, U.S. GDP fell for the first time since 2022, but in the second quarter, it posted its strongest growth since 2023. In other words, it's too early to say definitively whether the U.S. economy under Trump is expanding or contracting.
It's worth noting that global tariffs began to take effect in the second quarter — and with each passing month, more are being added. The economy's strong performance may not be due to real growth, but rather a one-off boost from increased revenue under the new tariff regime. For the first time in years, the U.S. posted a monthly budget surplus this summer.
However, other indicators are moving in the opposite direction, even amid strong Q2 growth. Business activity is declining, unemployment is rising, and industrial production is slowing. Inflation has been accelerating again since the summer, prompting the Federal Reserve to cut interest rates in an effort to save the job market. As a result, inflation is likely to continue rising under current conditions.
The U.S. national debt continues its climb — just as it has every year. It now stands at $37.9 trillion, a new all-time high. But the U.S. debt behaves much like Bitcoin: it only goes up. To reverse the trend, it would be necessary to increase revenues and reduce spending. Trump, however, is doing the opposite — increasing both revenues and expenditures.
His "One Big Bill" calls for deep cuts to healthcare and social welfare programs (as a cost-saving measure), while at the same time cutting taxes and significantly boosting defense and military spending. This policy mix makes it clear that reducing the national debt is not truly on the agenda.
In October, the U.S. once again faced a government shutdown due to funding issues. Strange things are happening in financial markets — both Bitcoin and gold are hitting record highs, despite their vastly different risk profiles. The rise in gold makes sense. But Bitcoin? That's harder to explain.
Meanwhile, U.S. stocks keep rising, despite growing warnings from economists that the market is "severely overheated." The U.S. dollar has been steadily declining throughout 2025.
One has to wonder — could a "black swan" event be on its way to America?
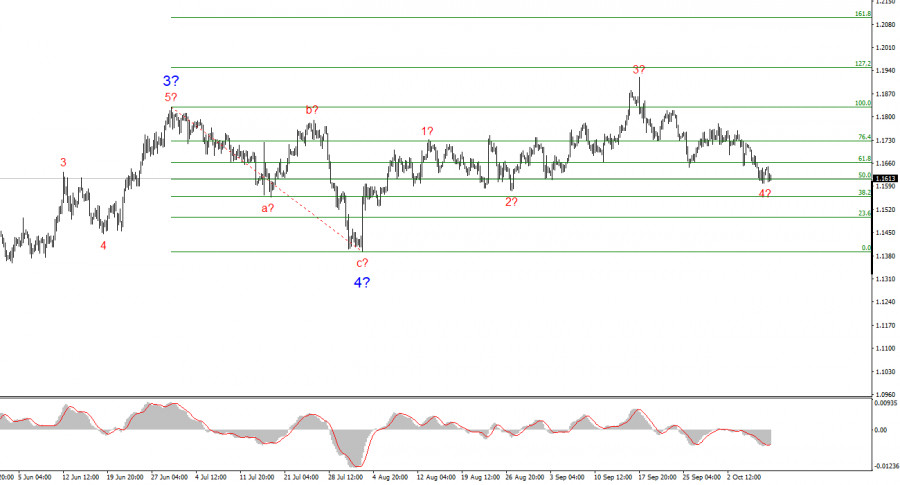
Based on my latest EUR/USD analysis, the pair continues to form an upward segment of the trend. The wave pattern remains entirely dependent on the news backdrop, especially policy decisions from Donald Trump and the domestic and foreign agenda of the new U.S. administration.
The current wave segment may extend up to the 1.25 mark. At the moment, the market is forming corrective wave 4, which may be nearing completion. The bullish wave structure remains intact, so I continue to consider only long positions. By the end of the year, I expect the euro to rise toward 1.2245, which corresponds to the 200.0% Fibonacci.
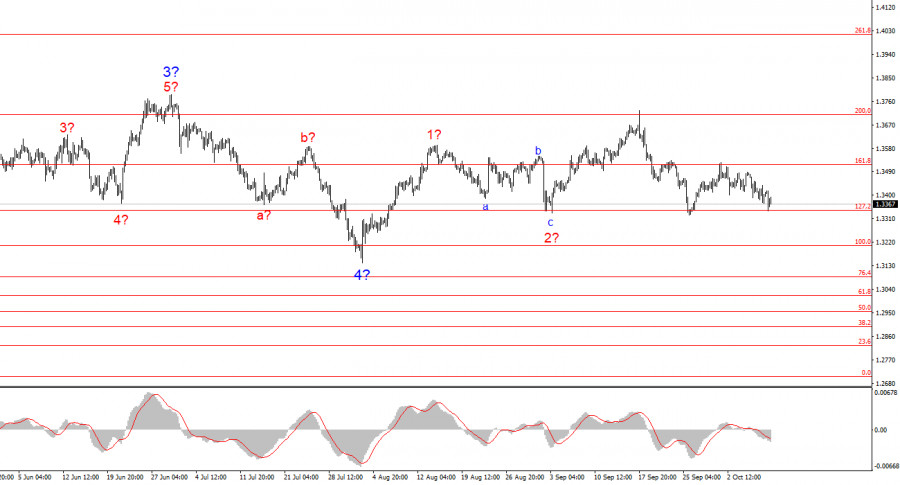
The wave pattern for GBP/USD has become more complex. We're still dealing with an upward impulsive wave, but its internal structure is becoming harder to read.
If wave 4 develops into a complex three-wave formation, the overall wave structure may return to balance. However, this would result in a significantly more extended and complicated wave 4 versus wave 2. In my opinion, the best reference point right now is the 1.3341 level, which corresponds to the 127.2% Fibonacci level. Two failed breakout attempts suggest the market is ready to buy on dips. A third failure may again move prices away from the recent lows. My targets for the pair remain above the 1.38 level.