BEVERLY HILLS, Kalifornie (Reuters) – Části amerického trhu s podnikovými dluhopisy vysílají varovné signály, že ochlazující se ekonomika tlačí na nejslabší dlužníky, uvedl představitel společnosti BlackRock (NYSE:BLK), a to navzdory všeobecným nadějím trhu, že turbulence způsobená cly již ustoupila.
Trend is your friend—follow the trend. If you bought U.S. stocks earlier, there's nothing to worry about. If not, be patient. Wait for a pullback, then buy the dip. This is the current primary strategy for trading the S&P 500. The broad stock index has closed in the red only two times over the last ten sessions. However, it's premature to speak of any meaningful correction.
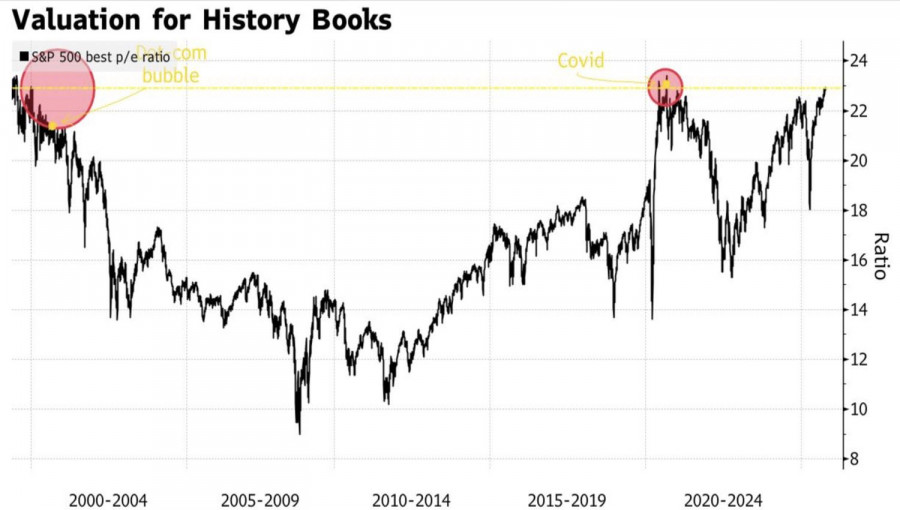
Regardless of lofty fundamentals, the stock market still holds strong cards. Yes, the price-to-expected-earnings ratio for the S&P 500 is fluctuating near the highest levels seen since the dotcom crisis. However, a still-strong U.S. economy, continued Federal Reserve monetary expansion, artificial intelligence technologies, and expectations of positive Q3 corporate earnings are all contributing factors to the resilience of the uptrend.
The broad stock index may transition into consolidation due to market fatigue, but a deep pullback is unlikely. Truist notes that since 1957, the current "bull" market ranks as the 11th in history. Since the October 2022 lows, the S&P 500 has risen by 90%. This is below the median growth observed in similar previous trends. Moreover, 7 out of the last 10 bullish cycles lasted more than three years.
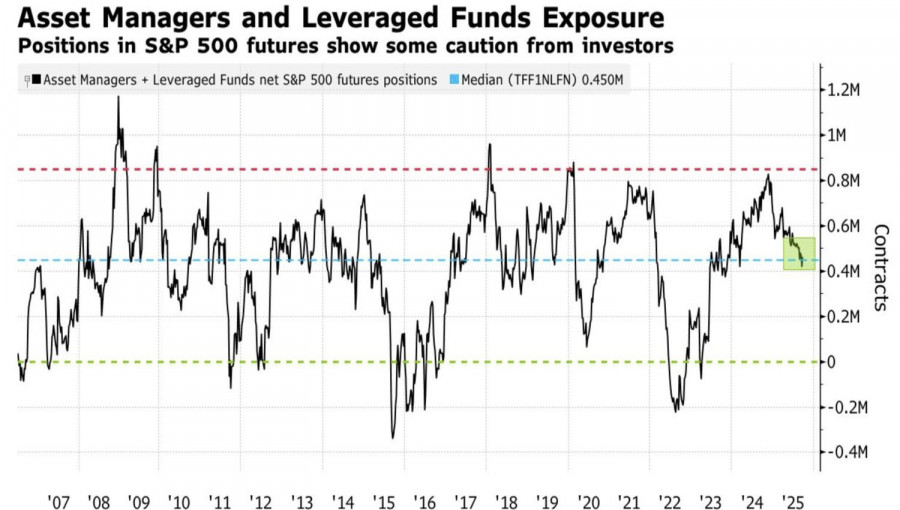
Therefore, the S&P 500 still has room to grow—especially with speculative positioning from traders, hedge funds, and asset managers far from extreme levels.
The threat of a government shutdown does not shake the broad stock index. Particularly as negotiations between Democrats and Republicans increase the likelihood that it will end soon. One proposal under discussion is a temporary extension of the Affordable Care Act, with new exceptions for wealthy Americans earning over $200,000 per year.
This government shutdown may not last 35 days as it did during Donald Trump's first term. Is that better for the S&P 500? It's hard to say. A shutdown forces the Fed to act blindly—cutting rates without employment or inflation data. Only a cooling economy would push the central bank to continue its monetary expansion cycle, should the government quickly resume its operations.
For now, the market is overlooking the division within the Fed. While New York Fed President John Williams is ready to continue rate cuts amid a cooling labor market, his FOMC colleague Michael Barr is concerned about inflation risks in the U.S. Have the derivatives markets overestimated the likelihood of monetary expansion in 2025?
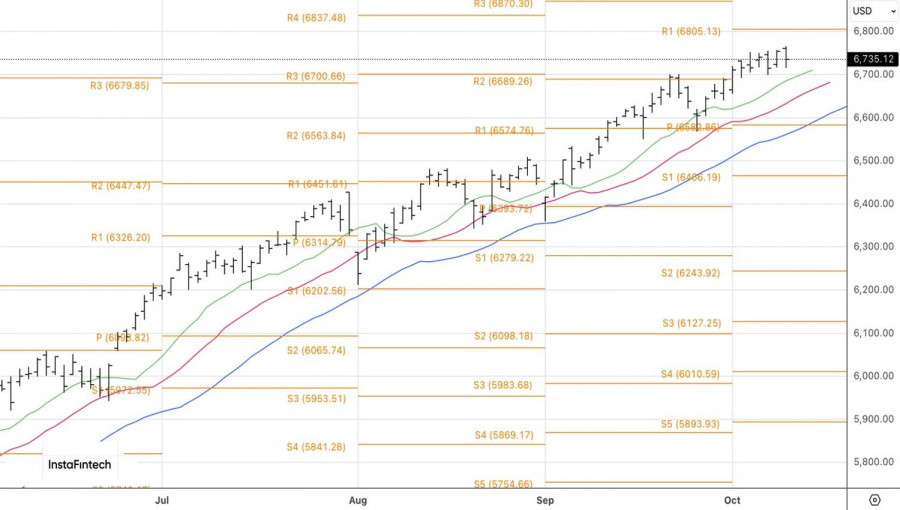
Technically, on the daily chart, the S&P 500 is exhibiting mixed bar dynamics. This increases the risk of forming a consolidation zone between 6650 and 6800. It is advisable to shift from outright purchases of the broad index to short-term selling on upward moves, followed by a strategic reversal and formation of long-term long positions.