The EUR/USD currency pair on Wednesday showed signs of exhaustion in its upward move and paused briefly. Throughout the day, volatility in movements was minimal, but it is worth noting that there were no significant macroeconomic events, and the market is no longer paying attention to secondary geopolitical news. An industrial production report was released in the Eurozone. Who cares about industrial production right now? Donald Trump announced this morning that the war in the Middle East is over. It's good that Trump wants to end the war, but the U.S. is not at war with itself. Other countries may have a different opinion. Washington wants to conclude an agreement with Iran but is unwilling to make concessions. The Strait of Hormuz remains blocked by both Iran and the U.S. As we can see, there were quite a few events, but none warranted a trading reaction.
On the hourly timeframe, the upward trend remains evident, as indicated by the trend line. In general, unless a new geopolitical shock occurs soon, the European currency can continue to rise towards this year's highs. This is far from the euro's ceiling, as Trump's policies will continue to have a destructive impact on the national currency, the economy, trade relations, and the U.S. reputation.
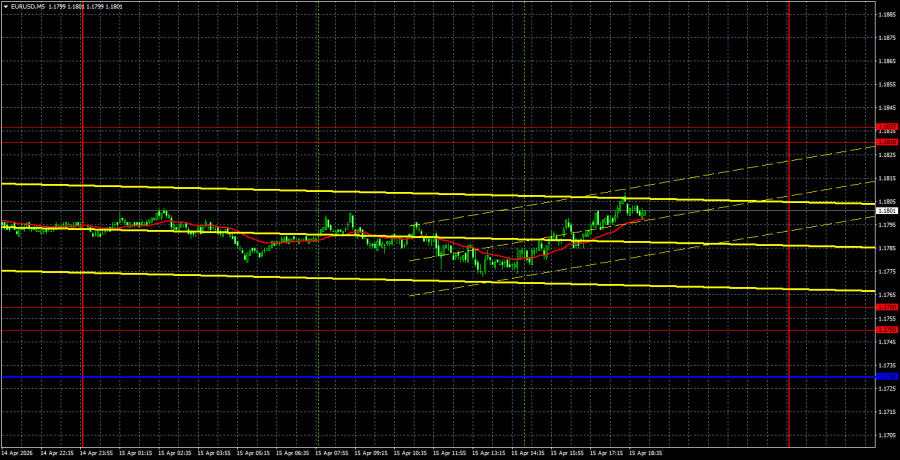
On the 5-minute timeframe, no trading signals were formed yesterday. The last buy signal was generated a day earlier with a rebound from the area of 1.1750-1.1760. We mentioned that long positions could carry over to Wednesday. Now they can be carried over to Thursday.
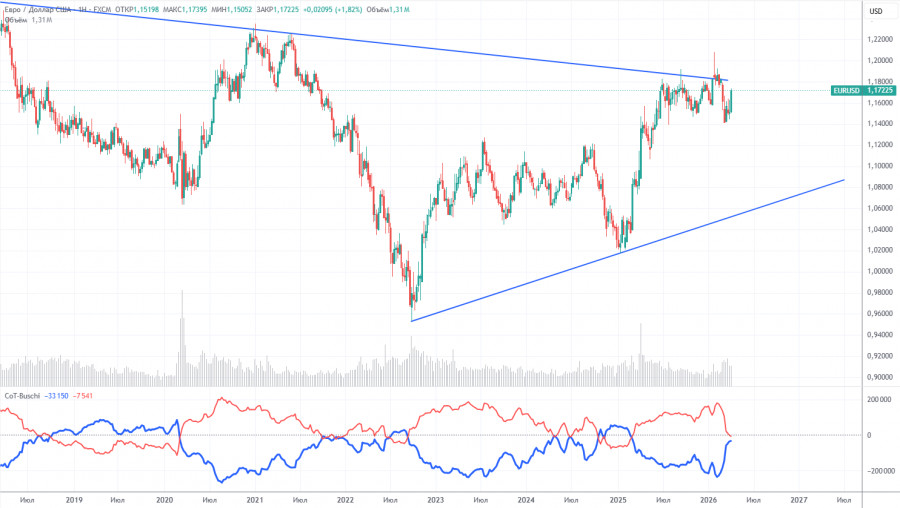
The latest COT report is dated April 7. The illustration for the weekly timeframe clearly shows that the net position of non-commercial traders remains "bullish," but is rapidly declining amid geopolitical events. Traders are massively shedding the euro in favor of the U.S. dollar. Donald Trump's policy has not changed, but the dollar now serves as a "reserve currency," ensuring strong demand for it.
We see no fundamental factors that would strengthen the euro; however, there are plenty that would weaken the dollar. The war in the Middle East temporarily made the dollar super-attractive, but once this factor's "shelf life" expires, everything will return to normal. In the long term, the euro may fall to 1.06 (the trendline), but the upward trend will remain intact. Currently, the pair has not deviated significantly from the descending trend line, which has been breached several times.
The position of the red and blue lines of the indicator indicates parity between bulls and bears. Over the last reporting week, the number of longs among the "Non-commercial" group increased by 800, while the number of shorts increased by 8,800. Accordingly, the net position decreased by another 8,000 contracts over the week.
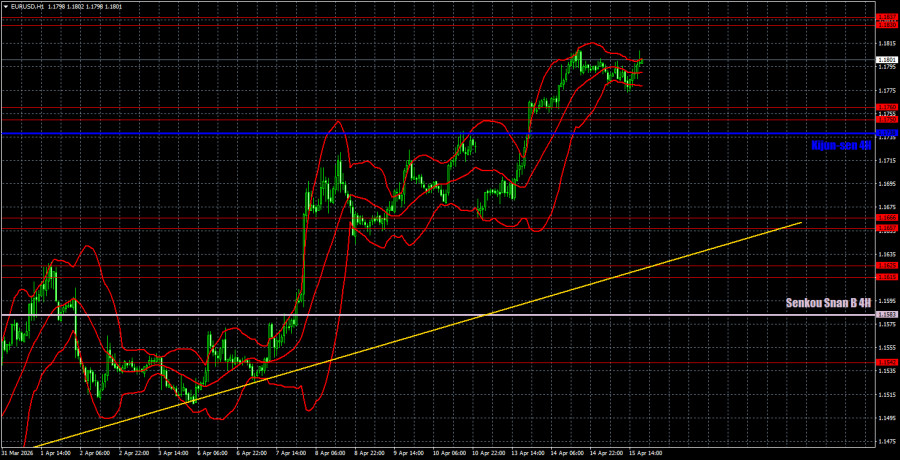
On the hourly timeframe, the EUR/USD pair continues its upward trend. A new escalation in the Middle East could again change traders' priorities, so any growth should be approached with caution. At the same time, the situation in the Middle East remains stably tense but is not worsening, so there are few strong reasons for further strengthening of the U.S. dollar. There are currently no technical grounds to expect a decline.
For April 16, we highlight the following trading levels — 1.1362, 1.1426, 1.1542, 1.1615-1.1625, 1.1657-1.1666, 1.1750-1.1760, 1.1830-1.1837, and 1.1907-1.1922, as well as the Senkou Span B line (1.1583) and Kijun-sen line (1.1730). The Ichimoku indicator lines may shift throughout the day, which should be taken into account when determining trading signals. Don't forget to set the Stop Loss order to breakeven if the price has moved in the right direction by 15 pips. This will protect against potential losses if the signal turns out to be false.
On Wednesday, the EU will publish the second estimate of March inflation, which is objectively less important than the first and rarely differs from it. In the U.S., reports on industrial production and weekly jobless claims are expected. We consider all three reports to be secondary.
On Thursday, traders may consider short positions if the price rebounds from the 1.1830-1.1837 area, with a target of 1.1750-1.1760. Long positions can be held with a target of 1.1750-1.1760, as the price rebounded from the 1.1657-1.1666 area. New long positions can be opened upon consolidation above the area of 1.1830-1.1837.
Support and resistance price levels are thick red lines around which the movement may end. They are not sources of trading signals.
The Kijun-sen and Senkou Span B lines are lines of the Ichimoku indicator, transferred to the hourly timeframe from the 4-hour timeframe. They are strong lines.
Extreme levels are thin red lines from which the price previously rebounded. They are sources of trading signals.
Yellow lines are trend lines, trend channels, and any other technical patterns.
Indicator 1 on the COT charts shows the size of the net position of each category of traders.