Společnost Cava Group se stala jedním z nejsledovanějších jmen na americké burze, zejména mezi investory hledajícími růstové příležitosti v oblasti rychlého občerstvení.
Firma, která se zaměřuje na středomořskou kuchyni, si získala pozornost díky svému podnikatelskému modelu, který mnohým připomíná úspěch společnosti Chipotle Mexican Grill (CMG). Zatímco Chipotle staví na mexické kuchyni, Cava (CAVA) nabízí zdravější alternativy, jako jsou čerstvé misky s hummusem, falafelem nebo pečeným kuřetem, a rychle expanduje napříč Spojenými státy.
Na konci prvního čtvrtletí fiskálního roku 2025 měla společnost 382 poboček ve 26 státech USA a ve Washingtonu D.C.. V letošním roce plánuje otevřít dalších 64 až 68 restaurací. Tím se výrazně přibližuje ke svému cíli dosáhnout 1 000 restaurací do roku 2032, což by v praxi znamenalo téměř ztrojnásobení počtu provozoven během sedmi let. Tento ambiciózní plán logicky přitahuje investory, kteří sázejí na dlouhodobý růst.

Cava Group nezaujala jen vizí expanze, ale také konkrétními výsledky. Tržby ve fiskálním prvním čtvrtletí dosáhly 329 milionů dolarů, což představuje meziroční nárůst o 28 %. K růstu významně přispěl i nárůst počtu restaurací, který během sledovaného období činil 18 %. Podstatné však je, že tržby rostou nejen kvůli přibývajícím pobočkám, ale i v rámci stávajících provozoven. Srovnatelné tržby vzrostly téměř o 11 %, což značí, že značka je mezi zákazníky čím dál populárnější.
Za celý fiskální rok 2024 se pak tržby zvýšily o 33 %, což posiluje dojem, že se nejedná o jednorázový růst, ale o dlouhodobější trend. Na výborné cestě je i ziskovost. Čistý zisk za první čtvrtletí dosáhl téměř 26 milionů dolarů, což je téměř dvojnásobek oproti stejnému období před rokem. Pokud bude tempo pokračovat, Cava by letos mohla překonat loňský čistý zisk ve výši 130 milionů dolarů.
Díky těmto výsledkům se objevují spekulace, zda Cava časem nenapodobí nejen expanzní strategii Chipotle, ale také globální dosah řetězce McDonald’s (MCD). Ten aktuálně provozuje více než 38 000 restaurací po celém světě. Cava zatím plánuje dosáhnout tisícovky v USA, ale mezinárodní expanze by v budoucnu nemusela být vyloučena.
I přes pozitivní čísla však existují důvody ke zdrženlivosti. Aktuální tržní kapitalizace Cava činí 11 miliard dolarů, což je stále výrazně méně než u Chipotle (cca 72 miliard USD) nebo McDonald’s (přes 210 miliard USD). Pokud by někdo dnes investoval do Cava částku 10 000 USD, musela by firma vyrůst na úroveň McDonald’s, aby investor z této investice vytvořil zisk přes 200 000 USD. To je výrazně daleko od milionového cíle.
Navíc poměr ceny k zisku (P/E) činí u Cava 72, což je výrazně nad průměrem trhu i nad hodnotami u konkurence. Chipotle má P/E okolo 48, McDonald’s přibližně 26. Takto vysoké ocenění může zpomalit budoucí zhodnocení, protože očekávání jsou už nyní výrazně napjatá. Pokud se růst Cava zpomalí, její akcie by mohly čelit tlaku na pokles, dokud se ocenění nezblíží k průměru indexu S&P 500 (P/E kolem 30).
Další výzvou může být i omezený rozsah expanze. I když Cava plánuje růst, její aktuální cíle zůstávají výhradně na domácím trhu. Pokud by nedošlo ke globální expanzi, trh by mohl firmu začít vnímat jako růstově nasycenou dříve, než očekávané výnosy ospravedlní dnešní cenu akcií.
 $60.76
Z pohledu dlouhodobého investora nabízí Cava Group nepochybně zajímavý růstový příběh. Rychle se rozšiřující síť restaurací, rostoucí ziskovost a stabilní poptávka po zdravější alternativě rychlého občerstvení dávají smysl. Firma navíc působí v atraktivním segmentu, kde spotřebitelé čím dál častěji hledají kompromis mezi rychlostí a kvalitou.
Na druhé straně, očekávání ohledně mimořádného zhodnocení jsou zatím přehnaná. Aby se drobný investor stal díky akciím Cava milionářem, musela by firma zaznamenat extrémní expanzi a zároveň si zachovat vysokou ziskovost. Při současném ocenění a plánech expanze se taková návratnost jeví jako velmi nepravděpodobná.
Závěrem lze říci, že Cava Group je zajímavou příležitostí pro růstově orientované investory, kteří hledají nové značky se silným tržním potenciálem. Pro ty, kteří očekávají násobné zhodnocení v krátkém čase, však zatím nenabízí dostatečně přesvědčivý scénář. Vývoj firmy bude i nadále záviset na jejím tempu expanze, schopnosti konkurovat a udržení důvěry investorů.
The EUR/USD currency pair failed to continue the downward move on Thursday, even though the day provided grounds for a new decline. The day's most important report — the US ISM services business activity index — showed a higher-than-expected reading, yet the dollar fell that day. This convinced us that the macroeconomic backdrop still has no real influence on FX market moves. Recall that this week, all reports in the EU and the US (except the latest ISM report) were unfavorable for the dollar. Nevertheless, the US currency rose during the first three days of the week. On Thursday, it fell instead, even though ISM should have supported it. Thus, we tend to believe the issue is Federal Reserve monetary policy. The market does not understand what to expect from the September meeting, so it keeps swinging. As the probability of monetary tightening fell again, the US dollar began to decline. We also remind traders that in the medium and long term the euro is biased upward.
Technically, the pair has completed the downward trend, as evidenced by the break of the trend line. However, the Senkou Span B line has not yet been overcome, so in theory the dollar's rise could still resume. Today, the pair's dynamics will be entirely dependent on Nonfarm Payrolls and the unemployment rate.
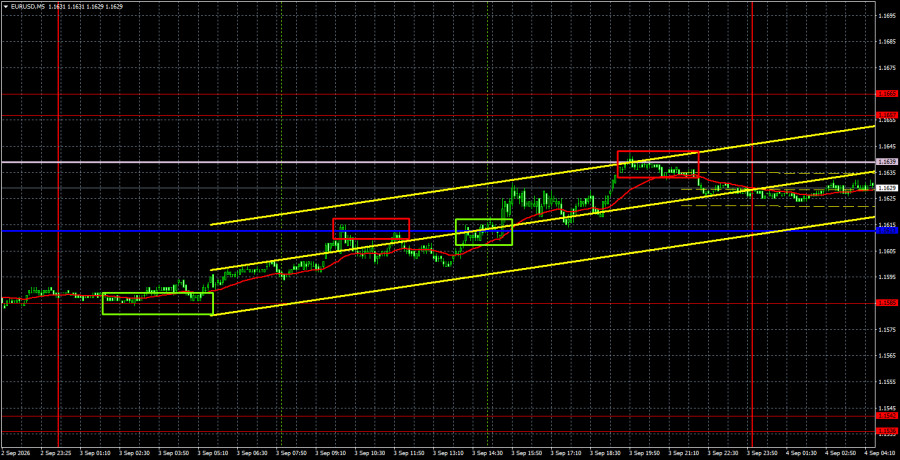
On the 5-minute TF on Friday, four trading signals were generated, but whether they were worth trading is a big question. First, the only important report of the day pointed to a decline in the pair, even as we observed its rise all day. Second, the signals formed between Ichimoku lines and levels separated by only 20–30 pips. Opening trades aiming for just 20–30 pips was, at best, impractical.
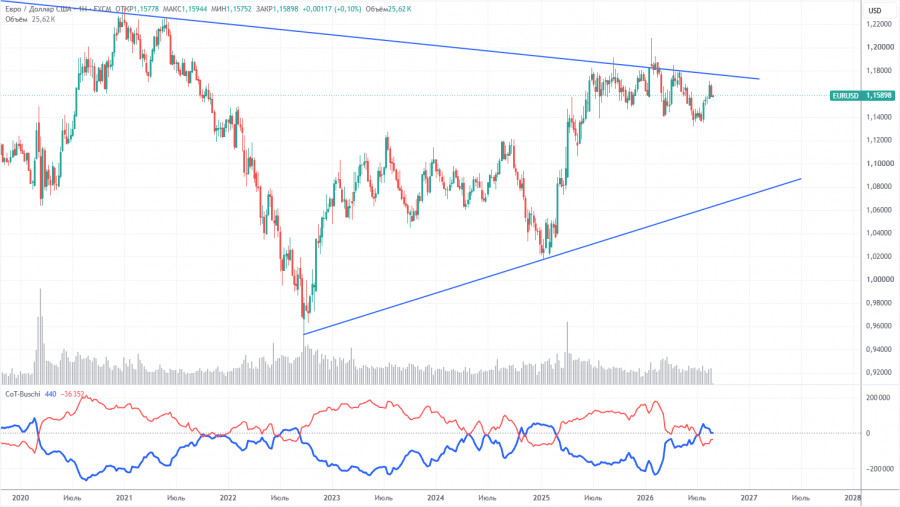
The latest COT report is dated August 25. On the weekly TF, it is clear that the non-commercial traders' net position turned "bearish" and fell significantly in 2026 due to geopolitical events. Traders have been trimming euro exposure in favor of the US dollar in recent months. Trump's policy has not changed, but the dollar has, for a time, acted as the "reserve currency."
We still see no fundamental factors to strengthen the US currency. The Middle East war made the dollar temporarily super-attractive, but when that factor expires, everything will return to normal — and this process may already be complete. In the long term, the euro could fall as low as $1.08 (trend line), but the uptrend will remain relevant. After recent months of dollar strength, the pair has not come close to that trend line.
The red and blue COT indicator lines point to approximate parity between bulls and bears. During the last reporting week, the number of long positions among Non-commercials rose by 2,700, while short positions decreased by 20,000. Accordingly, the net position increased by 22,700 contracts for the week.
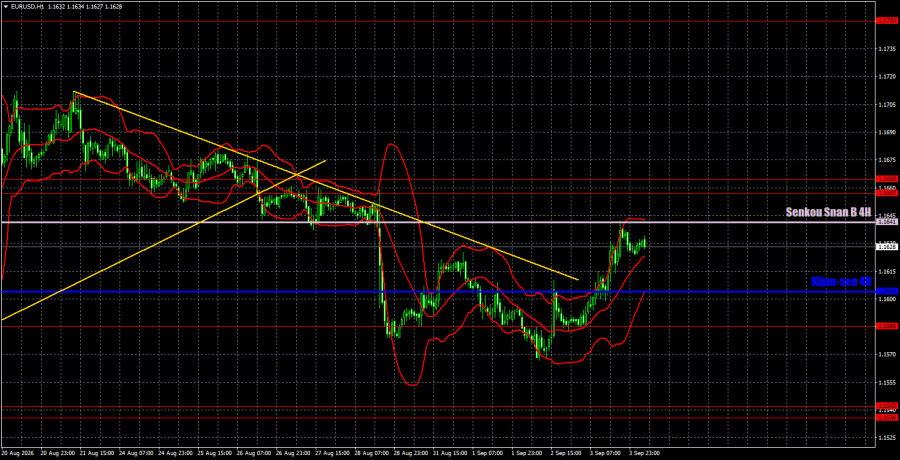
On the hourly timeframe, the EUR/USD pair may begin a new upward trend. The situation in the Middle East remains tense and is not improving, but this is insufficient to trigger a new, powerful dollar rally. Kevin Warsh's comments and the annual Nonfarms supported the dollar, but we see no strong grounds for optimism about the US currency. Overcoming the Senkou Span B line will open the way up for the euro.
For September 4 we highlight the following trading levels — 1.1234, 1.1274, 1.1362–1.1368, 1.1461–1.1473, 1.1536–1.1542, 1.1585, 1.1657–1.1665, 1.1750–1.1760, 1.1786, 1.1830–1.1837, and also the Senkou Span B (1.1641) and Kijun-sen (1.1604) lines. Ichimoku lines may shift during the day, which should be taken into account when determining trading signals. Do not forget to move the stop loss to breakeven if the price moves 15 pips in the correct direction. This will protect you from potential losses if the signal proves false.
On Friday, the EU will publish a relatively unimportant retail sales report that is unlikely to attract the market's attention. In the US today are the week's reports — Nonfarm Payrolls and the unemployment rate. These reports largely determine the Fed's September decision and market expectations, so traders' reaction today may be strong.
Today, traders may consider short positions targeting 1.1585–1.1604, or lower, if the price bounces off the Senkou Span B line. A break above the 1.1657–1.1665 area would allow opening long positions targeting 1.1750–1.1760.